Page 564 - Shaping smarter and more sustainable cities - Striving for sustainable development goals
P. 564

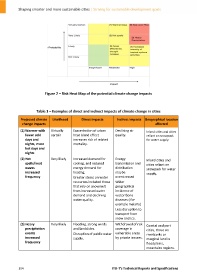
Figure 2 – Risk Heat Map of the potential climate change impacts


                       Table 1 – Examples of direct and indirect impacts of climate change in cities

              Projected climate   Likelihood      Direct impacts        Indirect impacts  Geographical location
              change impacts                                                                   affected
             (1) Warmer with    Virtually    Exacerbation of urban     Declining air      Inland cities and cities
                fewer cold      certain      heat island effect        quality.           reliant on snowpack
                days and                     increases risk of related                    for water supply.
                nights, more                 mortality.
                hot days and
                nights
             (2) Hot            Very likely   Increased demand for     Energy             Inland cities and
                spells/heat                  cooling, and reduced      transmission and   cities reliant on
                waves                        energy demand for         distribution       snowpack for water
                increased                    heating.                  maybe              supply.
                frequency                    Greater stress on water   overstressed
                                             resources included those   Wider
                                             that rely on snowmelt     geographical
                                             from increased water      incidence of
                                             demand and declining      vector bone
                                             water quality.            diseases ( for
                                                                       example malaria)
                                                                       Less disruption to
                                                                       transport from
                                                                       snow and ice.

             (3) Heavy          Very likely   Flooding, strong winds   Withdrawal of risk   Coastal and port
                precipitation                and landslides.           coverage in        cities, those on
                events                       Disruption of public water   vulnerable areas   riverbanks or
                increased                    supply.                   by private insures.   marginal land in
                frequency                                                                 floodplains,
                                                                                          mountains regions.


            554                                                      ITU‐T's Technical Reports and Specifications
   559   560   561   562   563   564   565   566   567   568   569