
Page 87 - ITU Kaleidoscope 2016
P. 87
ICTs for a Sustainable World
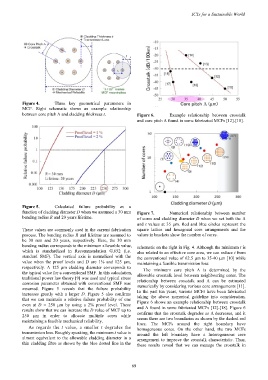
Figure 4. Three key geometrical parameters in
MCF. Right schematic shows an example relationship
between core pitch Λ and cladding thickness t. Figure 6. Example relationship between crosstalk
and core pitch Λ found in some fabricated MCFs [12]-[18].
Figure 5. Calculated failure probability as a
function of cladding diameter D when we assumed a 30 mm Figure 7. Numerical relationship between number
bending radius R and 20 years lifetime. of cores and cladding diameter D when we set both the Λ
and t values at 35 µm. Red and blue circles represent the
These values are commonly used in the current fabrication square lattice and hexagonal core arrangements and the
process. The bending radius R and lifetime are assumed to values in brackets show the number of cores.
be 30 mm and 20 years, respectively. Here, the 30 mm
bending radius corresponds to the minimum allowable value, schematic on the right in Fig. 4. Although the minimum t is
which is standardized in Recommendation G.652 (i.e. also related to an effective core area, we can reduce t from
standard SMF). The vertical axis is normalized with the the conventional value of 62.5 µm to 35-40 µm [10] while
value when the proof levels and D are 1% and 125 µm, maintaining a feasible transmission loss.
respectively. A 125 µm cladding diameter corresponds to The minimum core pitch Λ is determined by the
the typical value for a conventional SMF. In this calculation, allowable crosstalk level between neighbouring cores. The
traditional power law theory [9] was used and typical stress relationship between crosstalk and Λ can be estimated
corrosion parameter obtained with conventional SMF was numerically by considering various core arrangements [11].
assumed. Figure 5 reveals that the failure probability In the past ten years, various MCFs have been fabricated
increases greatly with a larger D. Figure 5 also confirms
that we can maintain a relative failure probability of one taking the above numerical guideline into consideration.
Figure 6 shows an example relationship between crosstalk
even at D = 250 µm by using a 2% proof level. These
results show that we can increase the D value of MCF up to and Λ found in some fabricated MCFs [12]-[18]. Figure 6
250 µm in order to allocate multiple cores while confirms that the crosstalk degrades as Λ decreases, and it
seems there are two boundaries as shown by the dashed red
maintaining a feasible mechanical reliability. lines. The MCFs around the right boundary have
As regards the t value, a smaller t degrades the homogeneous cores. On the other hand, the two MCFs
transmission loss. Roughly speaking, the minimum t value is around the left boundary have a heterogeneous core
almost equivalent to the allowable cladding diameter in a arrangement to improve the crosstalk characteristic. Thus,
thin cladding fibre as shown by the blue dotted line in the these results reveal that we can manage the crosstalk in
– 69 –