
Page 354 - Kaleidoscope Academic Conference Proceedings 2024
P. 354
2024 ITU Kaleidoscope Academic Conference
Telecom subscribers' QoS depends on signal strength. problem. Linear Regression (LR), Locally Weighted
Different signal strengths indicate different signal quality. Regression, Random Forest (RF), Artificial Neural
Within a range, telecom subscribers receive the same service Networks (ANNs), and others are popular [14] algorithms
quality. The operator prioritizes the prediction of good and used.
bad coverage over signal strength [17]. Thus, these signal Before inputting the data into the selected machine learning
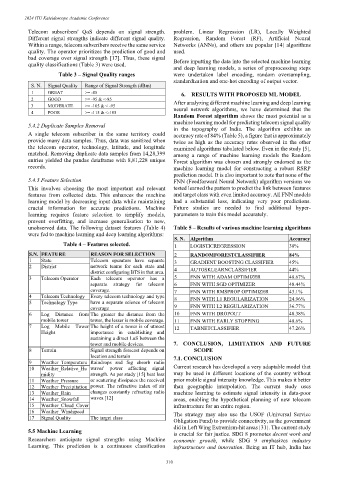
quality classifications (Table 3) were used.
and deep learning models, a series of preprocessing steps
Table 3 – Signal Quality ranges were undertaken label encoding, random oversampling,
standardization and one-hot encoding of output vector.
S. N. Signal Quality Range of Signal Strength (dBm)
1 GREAT >= -85 6. RESULTS WITH PROPOSED ML MODEL
2 GOOD >= -95 & <-85 After analyzing different machine learning and deep learning
3 MODERATE >= -105 & < -95 neural network algorithms, we have determined that the
4 POOR >= -115 & <-105
Random Forest algorithm shows the most potential as a
machine learning model for predicting telecom signal quality
5.4.2 Duplicate Samples Removal in the topography of India. The algorithm exhibits an
A single telecom subscriber in the same territory could accuracy rate of 84% (Table 5), a figure that is approximately
provide many data samples. Thus, data was sanitized when twice as high as the accuracy rates observed in the other
the telecom operator, technology, latitude, and longitude examined algorithms tabulated below. Even in the study [5],
matched. Removing duplicate data samples from 14,28,399 among a range of machine learning models the Random
entries yielded the pandas dataframe with 8,81,228 unique Forest algorithm was chosen and strongly endorsed as the
records. machine learning model for constructing a robust RSRP
prediction model. It is also important to note that none of the
5.4.3 Feature Selection FNN (Feedforward Neural Network) algorithm versions we
This involves choosing the most important and relevant tested learned the pattern to predict the link between features
features from collected data. This enhances the machine and target class with even limited accuracy. All FNN models
learning model by decreasing input data while maintaining had a substantial loss, indicating very poor predictions.
crucial information for accurate predictions. Machine Future studies are needed to find additional hyper-
learning requires feature selection to simplify models, parameters to train this model accurately.
prevent overfitting, and increase generalisation to new,
unobserved data. The following dataset features (Table 4) Table 5 – Results of various machine learning algorithms
were fed to machine learning and deep learning algorithms:
S. N. Algorithm Accuracy
Table 4 – Features selected. 1 LOGISTICREGRESSION 38%
S.N. FEATURE REASON FOR SELECTION 2 RANDOMFORESTCLASSIFIER 84%
1 State Telecom operators have separate 3 GRADIENT BOOSTING CLASSIFIER 45%
2 District network teams for each state and
district configuring BTS in that area. 4 AUTOSKLEARNCLASSIFIER 44%
3 Telecom Operator Each telecom operator has a 5 FNN WITH ADAM OPTIMIZER 48.67%
separate strategy for telecom 6 FNN WITH SGD OPTIMIZER 48.44%
coverage. 7 FNN WITH RMSPROP OPTIMIZER 43.1%
4 Telecom Technology Every telecom technology and type 8 FNN WITH L1 REGULARIZATION 24.96%
5 Technology Type have a separate science of telecom
coverage 9 FNN WITH L2 REGULARIZATION 36.77%
6 Log Distance from The greater the distance from the 10 FNN WITH DROPOUT 48.38%
mobile tower tower, the lesser is mobile coverage. 11 FNN WITH EARLY STOPPING 48.6%
7 Log Mobile Tower The height of a tower is of utmost 12 TABNETCLASSIFIER 47.26%
Height importance in establishing and
sustaining a direct LoS between the
tower and mobile devices. 7. CONCLUSION, LIMITATION AND FUTURE
8 Terrain Signal strength forecast depends on SCOPE
location and terrain 7.1. CONCLUSION
9 Weather_Temperature Raindrops and fog absorb radio
10 Weather_Relative_Hu waves' power affecting signal Current research has developed a very adaptable model that
midity strength. As per study [15] heat loss may be used in different locations of the country without
11 Weather_Pressure or scattering dissipates the received prior mobile signal intensity knowledge. This makes it better
12 Weather_Precipitation power. The refractive index of air than geographic interpolation. The current study uses
13 Weather_Rain changes constantly refracting radio machine learning to estimate signal intensity in data-poor
14 Weather_Snowfall waves.[12] areas, enabling the hypothetical planning of new telecom
15 Weather_Cloud_Cover infrastructure for an entire region.
16 Weather_Windspeed The strategy may also use the USOF (Universal Service
17 Signal Quality The target class
Obligation Fund) to provide connectivity, as the government
did in Left Wing Extremism-hit areas [31]. The current study
5.5 Machine Learning
is crucial for fair justice. SDG 8 promotes decent work and
Researchers anticipate signal strengths using Machine economic growth, while SDG 9 emphasizes industry
Learning. This prediction is a continuous classification infrastructure and innovation. Being an IT hub, India has
– 310 –