
Page 353 - Kaleidoscope Academic Conference Proceedings 2024
P. 353
Innovation and Digital Transformation for a Sustainable World
A geospatial dashboard was developed to show the coverage scattering dissipates this received power. The air
status on the political map of India. A machine learning refractive index changes constantly, refracting radio
model was used to predict the mobile coverage at places for waves. Hence, the received signal strength fluctuates
which no data have been captured but have similar with atmospheric conditions [19].
characteristics to the locations whose telecom data is present.
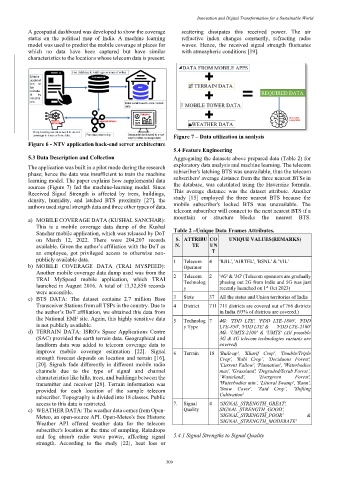
Figure 7 – Data utilization in analysis
Figure 6 - NTV application back-end server architecture
5.4 Feature Engineering
5.3 Data Description and Collection Aggregating the datasets above prepared data (Table 2) for
The application was built in a pilot mode during the research exploratory data analysis and machine learning. The telecom
phase; hence the data was insufficient to train the machine subscriber's latching BTS was unavailable, thus the telecom
learning model. The paper explains how supplemental data subscribers' average distance from the three nearest BTSs in
sources (Figure 7) fed the machine-learning model. Since the database, was calculated using the Haversine formula.
Received Signal Strength is affected by trees, buildings, This average distance was the dataset attribute. Another
density, humidity, and latched BTS proximity [27], the study [15] employed the three nearest BTS because the
authors used signal strength data and three other types of data. mobile subscriber's locked BTS was unavailable. The
telecom subscriber will connect to the next nearest BTS if a
mountain or structure blocks the nearest BTS.
a) MOBILE COVERAGE DATA (KUSHAL SANCHAR):
This is a mobile coverage data dump of the Kushal
Sanchar mobile application, which was released by DoT Table 2 –Unique Data Frames Attributes.
on March 12, 2022. There were 204,207 records S. ATTRIBU CO UNIQUE VALUES(REMARKS)
available. Given the author’s affiliation with the DoT as N. TE UN
an employee, got privileged access to otherwise non- T
publicly available data. 1 Telecom 4 'RJIL', 'AIRTEL', 'BSNL' & 'VIL'
b) MOBILE COVERAGE DATA (TRAI MYSPEED): Operator
Another mobile coverage data dump used was from the
TRAI MySpeed mobile application, which TRAI 2 Telecom 2 '4G' & '3G' (Telecom operators are gradually
phasing out 2G from India and 5G was just
Technolog
launched in August 2016. A total of 13,32,850 records y recently launched on 1 Oct 2023)
st
were accessible.
c) BTS DATA: The dataset contains 2.7 million Base 3 State 37 All the states and Union territories of India
Transceiver Stations from all TSPs in the country. Due to 4 District 711 711 districts are covered out of 766 districts
the author’s DoT affiliation, we obtained this data from in India (93% of districts are covered.)
the National EMF site. Again, this highly sensitive data 5 Technolog 7 4G: 'TDD LTE', 'FDD LTE-1800', 'FDD
is not publicly available. y Type LTE-850', 'FDD LTE' & 'FDD LTE-2100'
d) TERRAIN DATA: ISRO's Space Applications Centre 3G: 'UMTS-2100' & 'UMTS' (All possible
(SAC) provided the earth terrain data. Geographical and 3G & 4G telecom technologies variants are
landform data was added to telecom coverage data to covered)
improve mobile coverage estimation [22]. Signal 6 Terrain 18 'Built-up', 'Kharif Crop', 'Double/Triple
strength forecast depends on location and terrain [16], Crop', 'Rabi Crop’, 'Deciduous Forest',
[20]. Signals fade differently in different mobile radio 'Current Fallow', 'Plantation', 'Waterbodies
channels due to the type of signal and channel max', 'Grassland', 'Degraded/Scrub Forest’,
characteristics like hills, trees, and buildings between the ‘Wasteland', 'Evergreen Forest',
transmitter and receiver [28]. Terrain information was 'Waterbodies min’, 'Littoral Swamp', 'Rann',
provided for each location of the sample telecom 'Snow Cover', 'Zaid Crop’, ‘Shifting
subscriber. Topography is divided into 18 classes. Public Cultivation'
access to this data is restricted. 7. Signal 4 'SIGNAL_STRENGTH_GREAT',
e) WEATHER DATA: The weather data comes from Open- Quality SIGNAL_STRENGTH_GOOD',
Meteo, an open-source API. Open-Meteo's free Historic 'SIGNAL_STRENGTH_POOR' &
Weather API offered weather data for the telecom 'SIGNAL_STRENGTH_MODERATE'
subscriber's location at the time of sampling. Raindrops
and fog absorb radio wave power, affecting signal 5.4.1 Signal Strengths to Signal Quality
strength. According to the study [22], heat loss or
– 309 –