
Page 186 - Kaleidoscope Academic Conference Proceedings 2024
P. 186
2024 ITU Kaleidoscope Academic Conference
Offline Processing
Training Data Features Extraction Assigning mass D-S combination the highest mass Decision True Predicts the
Select the
hypothesis with
Region
value
False
Calculate the FSV of the
Region of the selected
Online Processing hypothesis
Select the attribute with the
Testing Dataset Features Extraction Assigning mass Calculate the differences for
smallest FSV
the selected attribute
Find the Region with the Returns the
smallest absolute difference Region
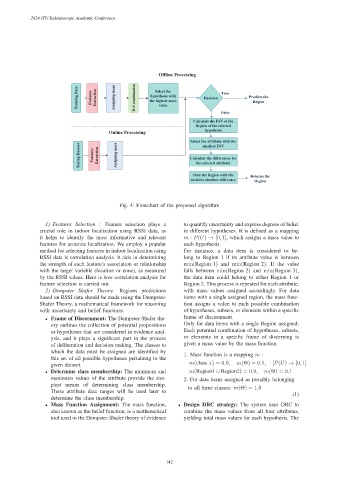
Fig. 4: Flowchart of the proposed algorithm
1) Features Selection : Feature selection plays a to quantify uncertainty and express degrees of belief
crucial role in indoor localisation using RSSI data, as in different hypotheses. It is defined as a mapping
it helps to identify the most informative and relevant m : P(U) → [0, 1], which assigns a mass value to
features for accurate localization. We employ a popular each hypothesis.
method for selecting features in indoor localisation using For instance, a data item is considered to be-
RSSI data is correlation analysis. It aids in determining long to Region 1 if its attribute value is between
the strength of each feature’s association or relationship min(Region 1) and min(Region 2). If the value
with the target variable (location or zone), as measured falls between min(Region 2) and min(Region 3),
by the RSSI values. Here is how correlation analysis for the data item could belong to either Region 1 or
feature selection is carried out. Region 2. This process is repeated for each attribute,
2) Dempster Shafer Theory: Regions predictions with mass values assigned accordingly. For data
based on RSSI data should be made using the Dempster- items with a single assigned region, the mass func-
Shafer Theory, a mathematical framework for reasoning tion assigns a value to each possible combination
with uncertainty and belief functions. of hypotheses, subsets, or elements within a specific
• Frame of Discernment: The Dempster-Shafer the- frame of discernment.
ory outlines the collection of potential propositions Only for data items with a single Region assigned:
or hypotheses that are considered in evidence anal- Each potential combination of hypotheses, subsets,
ysis, and it plays a significant part in the process or elements in a specific frame of discerning is
of deliberation and decision-making. The classes to given a mass value by the mass function.
which the data must be assigned are identified by 1. Mass function is a mapping m :
this set of all possible hypotheses pertaining to the
m(class x)=0.9, m(Θ) = 0.1, [P(U) → [0, 1]
given dataset.
• Determine class membership: The minimum and m(Region1 ∪ Region2)=0.9, m(Θ) = 0.1
maximum values of the attribute provide the sim- 2. For data items assigned as possibly belonging
plest means of determining class membership.
to all three classes: m(Θ) = 1.0
These attribute data ranges will be used later to
(1)
determine the class membership.
• Mass Function Assignment: The mass function, • Design DRC strategy: The system uses DRC to
also known as the belief function, is a mathematical combine the mass values from all four attributes,
tool used in the Dempster-Shafer theory of evidence yielding total mass values for each hypothesis. The
– 142 –