
Page 170 - Kaleidoscope Academic Conference Proceedings 2024
P. 170
2024 ITU Kaleidoscope Academic Conference
connections. This mechanism empowers the network to focus Table 1 – Hyper-parameters for training VGG16
on learning residual features, thus facilitating the training of
deeper architectures. Furthermore, ResNet18 incorporates Parameters Value
global average pooling (GAP) and a fully connected layer Batch size 20
at the end to generate final predictions. By leveraging Epochs 25
pre-trained weights from extensive datasets like ImageNet, Learning rate 0.0001
ResNet18 is fine-tuned on APTOS datasets in this study, Optimizer Stochastic Gradient Descent
rendering it suitable for DR detection.
3.4 Feature selection
Following feature extraction, the Kruskal-Wallis (KW)
test [15] is employed to identify the most significant
features. This test serves to reduce dimensions and enhance
classification performance in a non-parametric manner. By
computing group medians and comparing them, the KW
test determines whether the medians of any two groups are
equal, generating corresponding p-values. These p-values
signify the probability of observing the data under the null
hypothesis. Features with higher p-values are considered less
significant, whereas smaller p-values indicate rejection of the
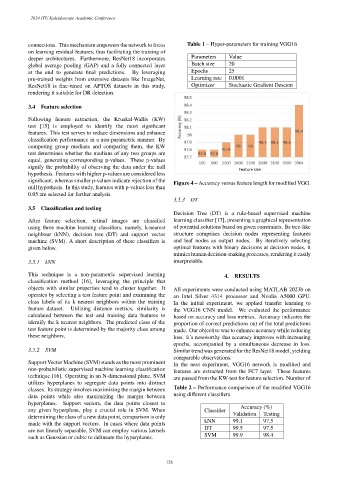
Figure 4 – Accuracy versus feature length for modified VGG.
null hypothesis. In this study, features with p-values less than
0.05 are selected for further analysis.
3.5.3 DT
3.5 Classification and testing
Decision Tree (DT) is a rule-based supervised machine
After feature selection, retinal images are classified learning classifier [17], presenting a graphical representation
using three machine learning classifiers, namely, k-nearest of potential solutions based on given constraints. Its tree-like
neighbour (kNN), decision tree (DT) and support vector structure comprises decision nodes representing features
machine (SVM). A short description of these classifiers is and leaf nodes as output nodes. By iteratively selecting
given below. optimal features with binary decisions at decision nodes, it
mimics human decision-making processes, rendering it easily
3.5.1 kNN interpretable.
This technique is a non-parametric supervised learning 4. RESULTS
classification method [16], leveraging the principle that
objects with similar properties tend to cluster together. It All experiments were conducted using MATLAB 2023b on
operates by selecting a test feature point and examining the an Intel Silver 4314 processor and Nvidia A5000 GPU.
class labels of its k nearest neighbors within the training In the initial experiment, we applied transfer learning to
feature dataset. Utilizing distance metrics, similarity is the VGG16 CNN model. We evaluated the performance
calculated between the test and training data features to based on accuracy and loss metrics. Accuracy indicates the
identify the k nearest neighbors. The predicted class of the proportion of correct predictions out of the total predictions
test feature point is determined by the majority class among made. Our objective was to enhance accuracy while reducing
these neighbors. loss. It’s noteworthy that accuracy improves with increasing
epochs, accompanied by a simultaneous decrease in loss.
3.5.2 SVM Similar trend was generated for the ResNet18 model, yielding
comparable observations.
Support Vector Machine (SVM) stands as the most prominent
In the next experiment, VGG16 network is modified and
non-probabilistic supervised machine learning classification
features are extracted from the FC7 layer. These features
technique [16]. Operating in an N-dimensional plane, SVM
are passed from the KW-test for feature selection. Number of
utilizes hyperplanes to segregate data points into distinct
classes. Its strategy involves maximizing the margin between Table 2 – Performance comparison of the modified VGG16
data points while also maximizing the margin between using different classifiers
hyperplanes. Support vectors, the data points closest to
Accuracy (%)
any given hyperplane, play a crucial role in SVM. When Classifier
determining the class of a new data point, comparison is only Validation Testing
kNN 99.1 97.5
made with the support vectors. In cases where data points
DT 99.5 97.5
are not linearly separable, SVM can employ various kernels
SVM 99.9 98.4
such as Gaussian or cubic to delineate the hyperplanes.
– 126 –