
Page 134 - Kaleidoscope Academic Conference Proceedings 2024
P. 134
2024 ITU Kaleidoscope Academic Conference
INCA functions
Control message
flow
UEs Controllers
5GC (Edge) & NTN 5GC DN
RAN (Central)
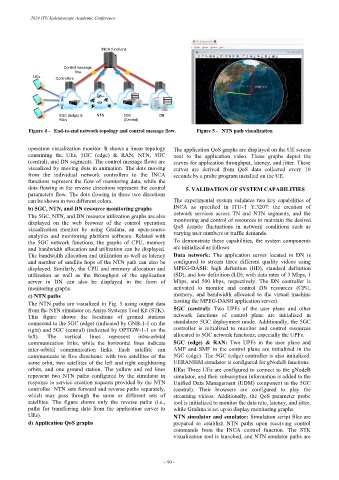
Figure 4 - End-to-end network topology and control message flow. Figure 5 - NTN path visualization
operation visualization monitor. It shows a linear topology The application QoS graphs are displayed on the UE screen
containing the UEs, 5GC (edge) & RAN, NTN, 5GC next to the application video. These graphs depict the
(central), and DN segments. The control message flows are curves for application throughput, latency, and jitter. These
visualized by moving dots in animation. The dots moving curves are derived from QoS data collected every 10
from the individual network controllers to the INCA seconds by a probe program installed on the UE.
functions represent the flow of monitoring data, while the
dots flowing in the reverse directions represent the control 5. VALIDATION OF SYSTEM CAPABILITIES
parameters flow. The dots flowing in these two directions
can be shown in two different colors. The experimental system validates two key capabilities of
b) 5GC, NTN, and DN resource monitoring graphs INCA as specified in ITU-T Y.3207: the creation of
The 5GC, NTN, and DN resource utilization graphs are also network services across TN and NTN segments, and the
displayed on the web browser of the control operation monitoring and control of resources to maintain the desired
visualization monitor by using Grafana, an open-source QoS despite fluctuations in network conditions such as
analytics and monitoring platform software. Related with varying user numbers or traffic demands.
the 5GC network functions, the graphs of CPU, memory To demonstrate these capabilities, the system components
and bandwidth allocation and utilization can be displayed. are initialized as follows:
The bandwidth allocation and utilization as well as latency Data network: The application server located in DN is
and number of satellite hops of the NTN path can also be configured to stream three different quality videos using
displayed. Similarly, the CPU and memory allocation and MPEG-DASH: high definition (HD), standard definition
utilization as well as the throughput of the application (SD), and low definition (LD), with data rates of 3 Mbps, 1
server in DN can also be displayed in the form of Mbps, and 500 kbps, respectively. The DN controller is
monitoring graphs. activated to monitor and control DN resources (CPU,
c) NTN paths memory, and bandwidth allocated to the virtual machine
The NTN paths are visualized in Fig. 5 using output data hosting the MPEG-DASH application server).
from the NTN simulator on Ansys Systems Tool Kit (STK). 5GC (central): Two UPFs of the user plane and other
This figure shows the locations of ground stations network functions of control plane are initialized in
connected to the 5GC (edge) (indicated by GNB-1-1 on the standalone 5GC deployment mode. Additionally, the 5GC
right) and 5GC (central) (indicated by OPTGW-1-1 on the controller is initialized to monitor and control resources
left). The vertical lines represent intra-orbital allocated to 5GC network functions, especially the UPFs.
communication links, while the horizontal lines indicate 5GC (edge) & RAN: Two UPFs in the user plane and
inter-orbital communication links. Each satellite can AMF and SMF in the control plane are initialized in the
communicate in five directions: with two satellites of the 5GC (edge). The 5GC (edge) controller is also initialized.
same orbit, two satellites of the left and right neighboring UERANSIM simulator is configured for gNodeB functions.
orbits, and one ground station. The yellow and red lines UEs: Three UEs are configured to connect to the gNodeB
represent two NTN paths configured by the simulator in simulator, and their subscription information is added to the
response to service creation requests provided by the NTN Unified Data Management (UDM) component in the 5GC
controller. NTN sets forward and reverse paths separately, (central). Their browsers are configured to play the
which may pass through the same or different sets of streaming videos. Additionally, the QoS parameter probe
satellites. The figure shows only the reverse paths (i.e., tool is initialized to monitor the data rate, latency, and jitter,
paths for transferring data from the application server to while Grafana is set up to display monitoring graphs.
UEs). NTN simulator and emulator: Simulation script files are
d) Application QoS graphs prepared to establish NTN paths upon receiving control
commands from the INCA control function. The STK
visualization tool is launched, and NTN emulator paths are
– 90 –