
Page 9 - The affordability of ICT services 2023
P. 9
The affordability of ICT services 2023
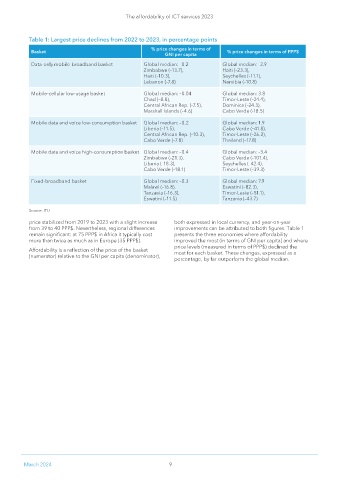
Table 1: Largest price declines from 2022 to 2023, in percentage points
% price changes in terms of
Basket % price changes in terms of PPP$
GNI per capita
Data-only mobile-broadband basket Global median: –0.2 Global median: –2.9
Zimbabwe (–13.7), Haiti (–23.3),
Haiti (–10.3), Seychelles (–11.1),
Lebanon (–7.8) Namibia (–10.8)
Mobile-cellular low-usage basket Global median: –0.04 Global median: 3.8
Chad (–8.8), Timor-Leste (–24.4),
Central African Rep. (–7.5), Dominica (–24.3),
Marshall Islands (–4.6) Cabo Verde (-18.5)
Mobile data and voice low-consumption basket Global median: –0.2 Global median: 1.9
Liberia (–11.5), Cabo Verde (–41.8),
Central African Rep. (–10.3), Timor-Leste (–26.2),
Cabo Verde (–7.8) Thailand (–17.8)
Mobile data and voice high-consumption basket Global median: –0.4 Global median: –3.4
Zimbabwe (–21.3), Cabo Verde (–101.4),
Liberia (–18.3), Seychelles (–42.4),
Cabo Verde (–18.1) Timor-Leste (–39.3)
Fixed-broadband basket Global median: –0.3 Global median: 7.9
Malawi (–16.8), Eswatini (–82.3),
Tanzania (–16.3), Timor-Leste (–51.1),
Eswatini (–11.5) Tanzania (–43.7)
Source: ITU
price stabilized from 2019 to 2023 with a slight increase both expressed in local currency, and year-on-year
from 39 to 40 PPP$. Nevertheless, regional differences improvements can be attributed to both figures. Table 1
remain significant: at 75 PPP$ in Africa it typically cost presents the three economies where affordability
more than twice as much as in Europe (35 PPP$). improved the most (in terms of GNI per capita) and where
price levels (measured in terms of PPP$) declined the
Affordability is a reflection of the price of the basket most for each basket. These changes, expressed as a
(numerator) relative to the GNI per capita (denominator),
percentage, by far outperform the global median.
March 2024 9