
Page 10 - The affordability of ICT services 2023
P. 10
The affordability of ICT services 2023
Overcoming the affordability Figure 11: Data-only mobile broadband
barrier with better regulation affordability and Internet use, by country groups,
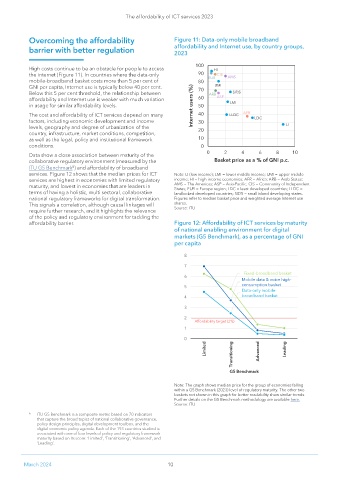
2023
100
High costs continue to be an obstacle for people to access HI
the internet (Figure 11). In countries where the data-only 90 CIS AMS
mobile-broadband basket costs more than 5 per cent of 80 EUR
GNI per capita, Internet use is typically below 40 per cent. 70 UMI
Below this 5 per cent threshold, the relationship between ARB SIDS
affordability and Internet use is weaker with much variation 60 ASP
in usage for similar affordability levels. Internet users (%) 50 LMI
The cost and affordability of ICT services depend on many 40 LLDC AFR
factors, including economic development and income 30 LDC
levels, geography and degree of urbanization of the 20 LI
country, infrastructure, market conditions, competition,
as well as the legal, policy and institutional framework 10
conditions. 0
Data show a close association between maturity of the 0 2 4 6 8 10
collaborative regulatory environment (measured by the Basket price as a % of GNI p.c.
ITU G5 Benchmark ) and affordability of broadband
8
services. Figure 12 shows that the median prices for ICT Note: LI (low income); LMI = lower-middle income; UMI = upper-middle
services are highest in economies with limited regulatory income; HI = high-income economies; AFR = Africa; ARB = Arab States;
maturity, and lowest in economies that are leaders in AMS = The Americas; ASP = Asia-Pacific; CIS = Community of Independent
States; EUR = Europe region; LDC = least developed countries; LLDC =
terms of having a holistic, multi sectoral, collaborative landlocked developed countries; SIDS = small island developing states.
national regulatory frameworks for digital transformation. Figures refer to median basket price and weighted average Internet use
This signals a correlation, although causal linkages will shares.
require further research, and it highlights the relevance Source: ITU
of the policy and regulatory environment for tackling the
affordability barrier. Figure 12: Affordability of ICT services by maturity
of national enabling environment for digital
markets (G5 Benchmark), as a percentage of GNI
per capita
8
7
Fixed-broadband basket
6
Mobile data & voice high-
5 consumption basket
Data-only mobile-
4 broadband basket
3
2
Affordability target (2%)
1
0
Limited Transitioning Advanced Leading
G5 Benchmark
Note: The graph shows median price for the group of economies falling
within a G5 Benchmark (2023) level of regulatory maturity. The other two
baskets not shown in this graph for better readability show similar trends.
Further details on the G5 Benchmark methodology are available here.
Source: ITU
8 ITU G5 Benchmark is a composite metric based on 70 indicators
that capture the broad topics of national collaborative governance,
policy design principles, digital development toolbox, and the
digital economic policy agenda. Each of the 193 countries studied is
associated with one of four levels of policy and regulatory framework
maturity based on its score: ‘Limited’, ‘Transitioning’, ‘Advanced’, and
‘Leading’.
March 2024 10