
Page 6 - The affordability of ICT services 2023
P. 6
The affordability of ICT services 2023
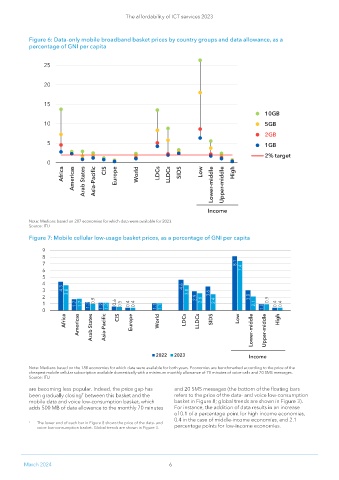
Figure 6: Data-only mobile broadband basket prices by country groups and data allowance, as a
percentage of GNI per capita
25
20
15
10GB
10 5GB
2GB
5 1GB
2% target
0
Africa Americas Arab States Asia-Pacific CIS Europe World LDCs LLDCs SIDS Low Lower-middle Upper-middle High
Income
Note: Medians based on 207 economies for which data were available for 2023.
Source: ITU
Figure 7: Mobile cellular low-usage basket prices, as a percentage of GNI per capita
9
8
7
6
5
4
3
2
1
0
Africa Americas Arab States Asia-Pacific CIS Europe World LDCs LLDCs SIDS Low Lower-middle Upper-middle High
2022 2023 Income
Note: Medians based on the 188 economies for which data were available for both years. Economies are benchmarked according to the price of the
cheapest mobile cellular subscription available domestically with a minimum monthly allowance of 70 minutes of voice calls and 20 SMS messages.
Source: ITU
are becoming less popular. Indeed, the price gap has and 20 SMS messages (the bottom of the floating bars
7
been gradually closing between this basket and the refers to the price of the data- and voice low-consumption
mobile data and voice low-consumption basket, which basket in Figure 8; global trends are shown in Figure 3).
adds 500 MB of data allowance to the monthly 70 minutes For instance, the addition of data results in an increase
of 0.1 of a percentage point for high-income economies,
0.4 in the case of middle-income economies, and 2.1
7 The lower end of each bar in Figure 8 shows the price of the data- and
voice low-consumption basket. Global trends are shown in Figure 3. percentage points for low-income economies.
March 2024 6