
Page 255 - ITU Kaleidoscope 2016
P. 255
ICTs for a Sustainable World
Figure 9: Best Fresnel Zone in Lubumbashi.
Figure 8: Cyber-Healthcare Mesh Network.
4.5. Patient Condition Recognition
We conducted another set of experiments to compare the two
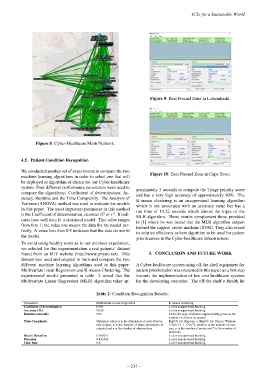
Figure 10: Best Fresnel Zone in Cape Town.
machine learning algorithms in order to select one that will
be deployed as algorithm of choice for our Cyber-healthcare
system. Four different performance parameters were used to
proximately 5 seconds to compute the Triage priority score
compare the algorithms: Coefficient of determination, Ac-
and has a very high accuracy of approximately 90%. The
curacy, Runtime and the Time Complexity. The Analysis of
K-means clustering is an unsupervised learning algorithm
Variance (ANOVA) method was used to evaluate the models
which is not associated with an accuracy value but has a
in this paper. The most important parameter in this method run time of 14.22 seconds which almost the triple of the
2
2
is the Coefficient of determination, denoted R or r . It indi-
MLR algorithm. These results complement those provided
cates how well data fit a statistical model. This value ranges
in [1] where its was found that the MLR algorithm outper-
from 0 to 1; the value one means the data fits the model per-
formed the support vector machine (SVM). They also reveal
fectly. A value less than 0.5 indicates that the data do not fit
its relative efficiency as best algorithm to be used for patient
the model.
prioritization in the Cyber-healthcare infrastructure.
To avoid using healthy users as in our previous experiment,
we selected for this experimentation a real patients’ dataset
found from an MIT website (http://www.physio.net). This 5. CONCLUSION AND FUTURE WORK
dataset was used and adapted to train and compare the two
different machine learning algorithms used in this paper: A Cyber-healthcare system using off-the-shelf equipment for
Multivariate linear Regression and K-means Clustering. The patient prioritization was presented in this paper as a first step
experimental results presented in table 2 reveal that the towards the implementation of low cost healthcare systems
Multivariate Linear Regression (MLR) algorithm takes ap- for the developing countries. The off-the-shelf e-Health kit
Table 2: Condition Recognition Results.
Parameters Multivariate Linear Regression K-means clustering
Coefficient of determination 0.903 n.a for unsupervised learning
Accuracy (%) 90.30 n.a for unsupervised learning
Runtime (seconds) 5.01 14.22 (for only 10 clusters exponentially grows as the
number of clusters increases)
Time Complexity O(pn+kn) where p is the dimension of each observa- Big(O) for Kmeans + Big(O) for Parzen Window
2
tion (input), k is the number of tasks (dimension of O(knT ) + O(n ), where k is the number of clus-
outputs) and n is the number of observations ters, ,n is the number of points and T is the number of
iterations.
Recal / Detection 0.769231 n.a for unsupervised learning
Precision 0.833333 n.a for unsupervised learning
False Rate 0.6 n.a for unsupervised learning
– 237 –