
Page 134 - Kaleidoscope Academic Conference Proceedings 2021
P. 134
2021 ITU Kaleidoscope Academic Conference
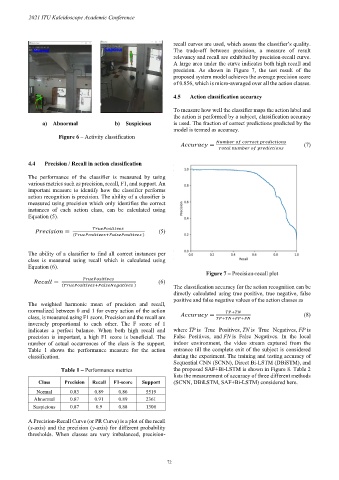
recall curves are used, which assess the classifier’s quality.
The trade-off between precision, a measure of result
relevancy and recall are exhibited by precision-recall curve.
A large area under the curve indicates both high recall and
precision. As shown in Figure 7, the test result of the
proposed system model achieves the average precision score
of 0.856, which is micro-averaged over all the action classes.
4.5 Action classification accuracy
To measure how well the classifier maps the action label and
the action is performed by a subject, classification accuracy
a) Abnormal b) Suspicious is used. The fraction of correct predictions predicted by the
model is termed as accuracy.
Figure 6 – Activity classification
(7)
4.4 Precision / Recall in action classification
The performance of the classifier is measured by using
various metrics such as precision, recall, F1, and support. An
important measure to identify how the classifier performs
action recognition is precision. The ability of a classifier is
measured using precision which only identifies the correct
instances of each action class, can be calculated using
Equation (5).
(5)
The ability of a classifier to find all correct instances per
class is measured using recall which is calculated using
Equation (6).
Figure 7 – Precision-recall plot
(6)
The classification accuracy for the action recognition can be
directly calculated using true positive, true negative, false
positive and false negative values of the action classes as
The weighted harmonic mean of precision and recall,
normalized between 0 and 1 for every action of the action
class, is measured using F1 score. Precision and the recall are (8)
inversely proportional to each other. The F score of 1
indicates a perfect balance. When both high recall and where TP is True Positives, TN is True Negatives, FP is
precision is important, a high F1 score is beneficial. The False Positives, and FN is False Negatives. In the local
number of actual occurrences of the class is the support. indoor environment, the video stream captured from the
Table 1 shows the performance measure for the action entrance till the complete exit of the subject is considered
classification. during the experiment. The training and testing accuracy of
Sequential CNN (SCNN), Direct Bi-LSTM (DBiSTM), and
Table 1 – Performance metrics the proposed SAF+Bi-LSTM is shown in Figure 8. Table 2
lists the measurement of accuracy of three different methods
Class Precision Recall F1-score Support (SCNN, DBiLSTM, SAF+Bi-LSTM) considered here.
Normal 0.83 0.89 0.86 5519
Abnormal 0.87 0.91 0.89 2361
Suspicious 0.87 0.9 0.88 1306
A Precision-Recall Curve (or PR Curve) is a plot of the recall
(x-axis) and the precision (y-axis) for different probability
thresholds. When classes are very imbalanced, precision-
– 72 –