
Page 71 - ITUJournal Future and evolving technologies Volume 2 (2021), Issue 1
P. 71
ITU Journal on Future and Evolving Technologies, Volume 2 (2021), Issue 1
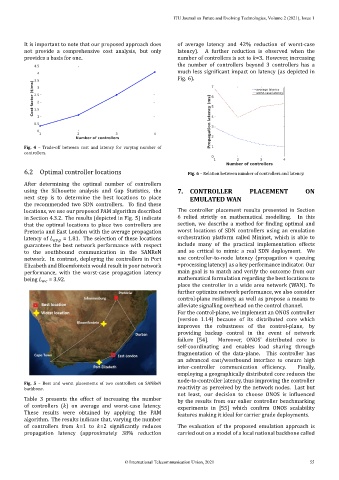
It is important to note that our proposed approach does of average latency and 42% reduction of worst‑case
not provide a comprehensive cost analysis, but only latency). A further reduction is observed when the
provides a basis for one. number of controllers is set to =3. However, increasing
the number of controllers beyond 3 controllers has a
much less signi icant impact on latency (as depicted in
Fig. 6).
Fig. 4 – Trade‑off between cost and latency for varying number of
controllers.
6.2 Optimal controller locations Fig. 6 – Relation between number of controllers and latency.
After determining the optimal number of controllers
using the Silhouette analysis and Gap Statistics, the 7. CONTROLLER PLACEMENT ON
next step is to determine the best locations to place EMULATED WAN
the recommended two SDN controllers. To ind these
locations, we use our proposed PAM algorithm described The controller placement results presented in Section
in Section 4.3.2. The results (depicted in Fig. 5) indicate 6 relied strictly on mathematical modelling. In this
that the optimal locations to place two controllers are section, we describe a method for inding optimal and
Pretoria and East London with the average propagation worst locations of SDN controllers using an emulation
latency of = 1.81. The selection of these locations orchestration platform called Mininet, which is able to
guarantees the best network performance with respect include many of the practical implementation effects
to the southbound communication in the SANReN and so critical to mimic a real SDN deployment. We
network. In contrast, deploying the controllers in Port use controller‑to‑node latency (propagation + queuing
Elizabeth and Bloemfontein would result in poor network +processing latency) as a key performance indicator. Our
performance, with the worst‑case propagation latency main goal is to match and verify the outcome from our
being = 3.92. mathematical formulation regarding the best locations to
place the controller in a wide area network (WAN). To
further optimize network performance, we also consider
control‑plane resiliency, as well as propose a means to
alleviate signalling overhead on the control channel.
For the control‑plane, we implement an ONOS controller
(version 1.14) because of its distributed core which
improves the robustness of the control‑plane, by
providing backup control in the event of network
failure [54]. Moreover, ONOS’ distributed core is
self‑coordinating and enables load sharing through
fragmentation of the data‑plane. This controller has
an advanced east/westbound interface to ensure high
inter‑controller communication ef iciency. Finally,
employing a geographically distributed core reduces the
node‑to‑controller latency, thus improving the controller
Fig. 5 – Best and worst placements of two controllers on SANReN
backbone. reactivity as perceived by the network nodes. Last but
not least, our decision to choose ONOS is in luenced
Table 3 presents the effect of increasing the number by the results from our ealier controller benchmarking
of controllers ( ) on average and worst‑case latency. experiments in [55] which con irm ONOS scalability
These results were obtained by applying the PAM features making it ideal for carrier grade deployments.
algorithm. The results indicate that, varying the number
of controllers from =1 to =2 signi icantly reduces The evaluation of the proposed emulation approach is
propagation latency (approximately 38% reduction carried out on a model of a local national backbone called
© International Telecommunication Union, 2021 55