
Page 70 - ITUJournal Future and evolving technologies Volume 2 (2021), Issue 1
P. 70
ITU Journal on Future and Evolving Technologies, Volume 2 (2021), Issue 1
clustering quality is the average intra‑cluster propagation
latency. Each blue horizontal bar in the plots represent
a switch and its corresponding silhouette score. A
silhouette score reveals the proximity of a switch to all
other switches outside and within its cluster. Silhouette
scores lie in the range of [‑1,1]. The desired score is
one that is closer to +1 as it indicates high proximity
of switches within the same cluster. On the other
hand, silhouette scores near ‑1 indicate high dissimilarity
within a cluster and is a sign of poor clustering quality. A
value of 0 shows that the switch is on or very close to the
decision boundary between two adjacent clusters [53].
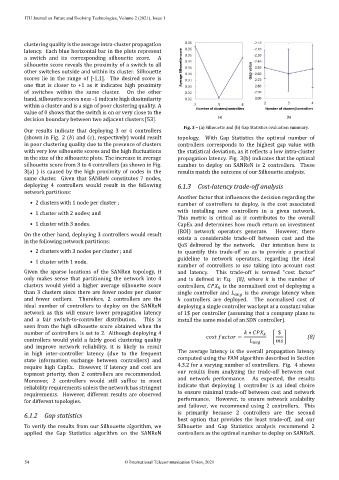
Fig. 3 – (a) Silhouette and (b) Gap Statistics evaluation summary.
Our results indicate that deploying 3 or 4 controllers
(shown in Fig. 2 ( ) and ( ), respectively) would result topology. With Gap Statistics the optimal number of
in poor clustering quality due to the presence of clusters controllers corresponds to the highest gap value with
with very low silhouette scores and the high luctuations the statistical deviation, as it re lects a low intra‑cluster
in the size of the silhouette plots. The increase in average propagation latency. Fig. 3(b) indicates that the optimal
silhouette score from 3 to 4 controllers (as shown in Fig. number to deploy on SANReN is 2 controllers. These
3(a) ) is caused by the high proximity of nodes in the results match the outcome of our Silhouette analysis.
same cluster. Given that SANReN constitutes 7 nodes,
deploying 4 controllers would result in the following 6.1.3 Cost‑latency trade‑off analysis
network partitions:
Another factor that in luences the decision regarding the
• 2 clusters with 1 node per cluster ; number of controllers to deploy, is the cost associated
• 1 cluster with 2 nodes; and with installing new controllers in a given network.
This metric is critical as it contributes to the overall
• 1 cluster with 3 nodes. CapEx and determines how much return on investment
(ROI) network operators generate. However, there
On the other hand, deploying 3 controllers would result exists a considerable trade‑off between cost and the
in the following network partitions:
QoS delivered by the network. Our intention here is
• 2 clusters with 3 nodes per cluster ; and to quantify this trade‑off so as to provide a practical
guideline to network operators, regarding the ideal
• 1 cluster with 1 node.
number of controllers to use taking into account cost
Given the sparse locations of the SANRen topology, it and latency. This trade‑off is termed ”cost factor”
only makes sense that partitioning the network into 4 and is de ined in Eq. (8), where is the number of
clusters would yield a higher average silhouette score controllers, is the normalised cost of deploying a
than 3 clusters since there are fewer nodes per cluster single controller and is the average latency when
and fewer outliers. Therefore, 2 controllers are the controllers are deployed. The normalised cost of
ideal number of controllers to deploy on the SANReN deploying a single controller was kept at a constant value
network as this will ensure lower propagation latency of 1$ per controller (assuming that a company plans to
and a fair switch‑to‑controller distribution. This is install the same model of an SDN controller).
seen from the high silhouette score obtained when the
number of controllers is set to 2. Although deploying 4 ∗ $
controllers would yield a fairly good clustering quality = (8)
and improve network reliability, it is likely to result
in high inter‑controller latency (due to the frequent The average latency is the overall propagation latency
state information exchange between controllers) and computed using the PAM algorithm described in Section
require high CapEx. However, if latency and cost are 4.3.2 for a varying number of controllers. Fig. 4 shows
topmost priority, then 2 controllers are recommended. our results from analyzing the trade‑off between cost
Moreover, 2 controllers would still suf ice to meet and network performance. As expected, the results
reliability requirements unless the network has stringent indicate that deploying 1 controller is an ideal choice
requirements. However, different results are observed to ensure minimal trade‑off between cost and network
for different topologies. performance. However, to ensure network scalability
and failover, we recommend using 2 controllers. This
6.1.2 Gap statistics is primarily because 2 controllers are the second
best option that provides the least trade‑off, and our
To verify the results from our Silhouette algorithm, we Silhouette and Gap Statistics analysis recommend 2
applied the Gap Statistics algorithm on the SANReN controllers as the optimal number to deploy on SANReN.
54 © International Telecommunication Union, 2021