
Page 99 - ITU Journal Future and evolving technologies Volume 2 (2021), Issue 6 – Wireless communication systems in beyond 5G era
P. 99
ITU Journal on Future and Evolving Technologies, Volume 2 (2021), Issue 6
Table 1 – Simulation paramteters
Parameter Value
Number of senders 1
Number of receivers 1
Number of interfered receivers 1
Number of IRS reflectors 20, 100
Number of antennas 1
Fig. 3 – Clustering by proposed method Propagation model i.i.d. Rayleigh fading
SNR 10 dB
We formulate the k-means method [18] in this Interference threshold (INR) 1 dB
paper as follows. Denoting the center of gravity of Loops 1000
each cluster as and that cluster as ( ), we
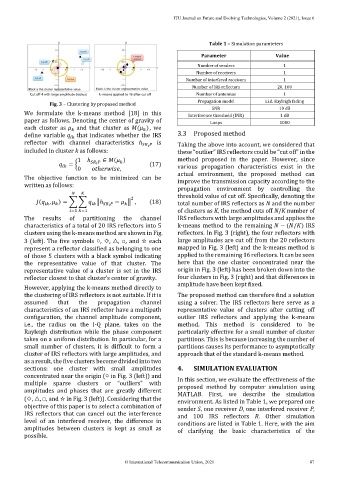
define variable that indicates whether the IRS 3.3 Proposed method
reflector with channel characteristics ℎ is Taking the above into account, we considered that
included in cluster k as follows: these “outlier” IRS reflectors could be “cut off” in the
1 ℎ ∈ ( ) method proposed in the paper. However, since
= { (17) various propagation characteristics exist in the
0 ℎ ,
The objective function to be minimized can be actual environment, the proposed method can
written as follows: improve the transmission capacity according to the
propagation environment by controlling the
threshold value of cut off. Specifically, denoting the
2
( , ) = ∑ ∑ ‖ℎ − ‖ , (18) total number of IRS reflectors as N and the number
=1 =1 of clusters as K, the method cuts off N/K number of
The results of partitioning the channel IRS reflectors with large amplitudes and applies the
characteristics of a total of 20 IRS reflectors into 5 k-means method to the remaining − ( / ) IRS
clusters using the k-means method are shown in Fig. reflectors. In Fig. 3 (right), the four reflectors with
3 (left). The five symbols ○, ◇, △, □, and ☆ each large amplitudes are cut off from the 20 reflectors
represent a reflector classified as belonging to one mapped in Fig. 3 (left) and the k-means method is
of those 5 clusters with a black symbol indicating applied to the remaining 16 reflectors. It can be seen
the representative value of that cluster. The here that the one cluster concentrated near the
representative value of a cluster is set in the IRS origin in Fig. 3 (left) has been broken down into the
reflector closest to that cluster’s center of gravity. four clusters in Fig. 3 (right) and that differences in
amplitude have been kept fixed.
However, applying the k-means method directly to
the clustering of IRS reflectors is not suitable. If it is The proposed method can therefore find a solution
assumed that the propagation channel using a solver. The IRS reflectors here serve as a
characteristics of an IRS reflector have a multipath representative value of clusters after cutting off
configuration, the channel amplitude component, outlier IRS reflectors and applying the k-means
i.e., the radius on the I-Q plane, takes on the method. This method is considered to be
Rayleigh distribution while the phase component particularly effective for a small number of cluster
takes on a uniform distribution. In particular, for a partitions. This is because increasing the number of
small number of clusters, it is difficult to form a partitions causes its performance to asymptotically
cluster of IRS reflectors with large amplitudes, and approach that of the standard k-means method.
as a result, the five clusters become divided into two
sections: one cluster with small amplitudes 4. SIMULATION EVALUATION
concentrated near the origin (○ in Fig. 3 (left)) and In this section, we evaluate the effectiveness of the
multiple sparse clusters or “outliers” with proposed method by computer simulation using
amplitudes and phases that are greatly different MATLAB. First, we describe the simulation
(◇, △, □, and ☆ in Fig. 3 (left)). Considering that the environment. As listed in Table 1, we prepared one
objective of this paper is to select a combination of sender S, one receiver D, one interfered receiver P,
IRS reflectors that can cancel out the interference and 100 IRS reflectors R. Other simulation
level of an interfered receiver, the difference in conditions are listed in Table 1. Here, with the aim
amplitudes between clusters is kept as small as of clarifying the basic characteristics of the
possible.
© International Telecommunication Union, 2021 87