
Page 99 - ITU Journal Future and evolving technologies Volume 2 (2021), Issue 4 – AI and machine learning solutions in 5G and future networks
P. 99
ITU Journal on Future and Evolving Technologies, Volume 2 (2021), Issue 4
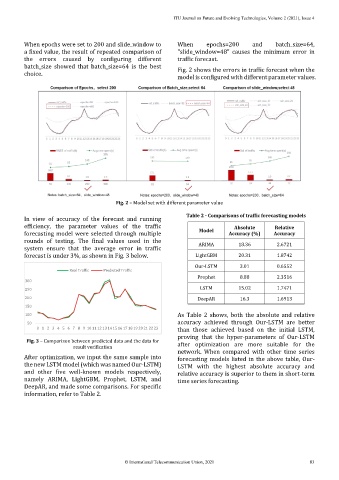
When epochs were set to 200 and slide_window to When epochs=200 and batch_size=64,
a fixed value, the result of repeated comparison of "slide_window=48" causes the minimum error in
the errors caused by configuring different traffic forecast.
batch_size showed that batch_size=64 is the best Fig. 2 shows the errors in traffic forecast when the
choice.
model is configured with different parameter values.
Fig. 2 – Model set with different parameter value
Table 2 - Comparisons of traffic forecasting models
In view of accuracy of the forecast and running
efficiency, the parameter values of the traffic Absolute Relative
forecasting model were selected through multiple Model Accuracy (%) Accuracy
rounds of testing. The final values used in the ARIMA 18.36 2.6721
system ensure that the average error in traffic
forecast is under 3%, as shown in Fig. 3 below. LightGBM 20.31 1.8742
Our-LSTM 3.01 0.6552
Real Traffic Predicted Traffic
Prophet 8.88 2.3516
300
250 LSTM 15.02 1.7471
200 DeepAR 16.3 1.6913
150
100 As Table 2 shows, both the absolute and relative
50 accuracy achieved through Our-LSTM are better
0 1 2 3 4 5 6 7 8 9 10 11 12 13 14 15 16 17 18 19 20 21 22 23 than those achieved based on the initial LSTM,
Fig. 3 – Comparison between predicted data and the data for proving that the hyper-parameters of Our-LSTM
result verification after optimization are more suitable for the
network. When compared with other time series
After optimization, we input the same sample into forecasting models listed in the above table, Our-
the new LSTM model (which was named Our-LSTM) LSTM with the highest absolute accuracy and
and other five well-known models respectively, relative accuracy is superior to them in short-term
namely ARIMA, LightGBM, Prophet, LSTM, and time series forecasting.
DeepAR, and made some comparisons. For specific
information, refer to Table 2.
© International Telecommunication Union, 2021 83