
Page 118 - ITU Journal Future and evolving technologies Volume 2 (2021), Issue 3 – Internet of Bio-Nano Things for health applications
P. 118
ITU Journal on Future and Evolving Technologies, Volume 2 (2021), Issue 3
where is the number of sub‑bands with each having a
width of Δ that is suf iciently small. The power distribu‑
tion that maximizes the capacity can be obtained by solv‑
ing the Lagrange multiplier problem. Hence, the solution
is given by [25]
− ( ) ∈
( ) = { (26)
0 ∉
where value satis ies (22).
4. PERFORMANCE EVALUATION
In this section, we irst present the leakage resistance and
capacitance trend graphically, and then the results of our
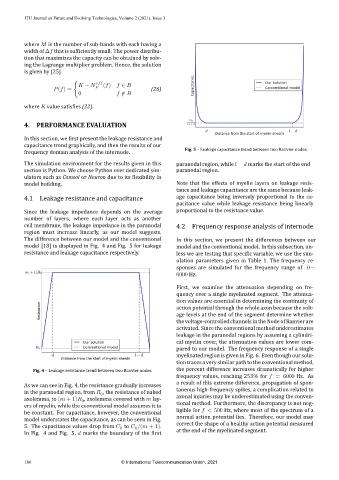
frequency domain analysis of the internode. Fig. 5 – Leakage capacitance trend between two Ranvier nodes.
The simulation environment for the results given in this paranodal region, while − marks the start of the end
section is Python. We choose Python over dedicated sim‑ paranodal region.
ulators such as Comsol or Neuron due to its lexibility in
model building. Note that the effects of myelin layers on leakage resis‑
tance and leakage capacitance are the same because leak‑
4.1 Leakage resistance and capacitance age capacitance being inversely proportional to the ca‑
pacitance value while leakage resistance being linearly
proportional to the resistance value.
Since the leakage impedance depends on the average
number of layers, where each layer acts as another
cell membrane, the leakage impedance in the paranodal 4.2 Frequency response analysis of internode
region must increase linearly, as our model suggests.
The difference between our model and the conventional In this section, we present the differences between our
model [18] is displayed in Fig. 4 and Fig. 5 for leakage model and the conventional model. In this subsection, un‑
resistance and leakage capacitance respectively. less we are testing that speci ic variable, we use the sim‑
ulation parameters given in Table 1. The frequency re‑
sponses are simulated for the frequency range of 0 −
6000 Hz.
First, we examine the attenuation depending on fre‑
quency over a single myelinated segment. The attenua‑
tion values are essential in determining the continuity of
action potential through the whole axon because the volt‑
age levels at the end of the segment determine whether
the voltage‑controlled channels in the Node of Ranvier are
activated. Since the conventional method underestimates
leakage in the paranodal regions by assuming a cylindri‑
cal myelin cover, the attenuation values are lower com‑
pared to our model. The frequency response of a single
myelinated region is given in Fig. 6. Even though our solu‑
tion traces a very similar path to the conventional method,
Fig. 4 – Leakage resistance trend between two Ranvier nodes. the percent difference increases dramatically for higher
frequency values, reaching 253% for = 6000 Hz. As
As we can see in Fig. 4, the resistance gradually increases a result of this extreme difference, propagation of spon‑
in the paranodal region, from , the resistance of naked taneous high‑frequency spikes, a complication related to
0
axolemma, to ( + 1) , axolemma covered with lay‑ axonal injuries may be underestimated using the conven‑
0
ers of myelin, while the conventional model assumes it to tional method. Furthermore, the discrepancy is not neg‑
be constant. For capacitance, however, the conventional ligible for < 500 Hz, where most of the spectrum of a
model understates the capacitance, as can be seen in Fig. normal action potential lies. Therefore, our model may
5. The capacitance values drop from to /( + 1). correct the shape of a healthy action potential measured
0
0
In Fig. 4 and Fig. 5, marks the boundary of the irst at the end of the myelinated segment.
106 © International Telecommunication Union, 2021