
Page 110 - ITU Journal Future and evolving technologies Volume 2 (2021), Issue 1
P. 110
ITU Journal on Future and Evolving Technologies, Volume 2 (2021), Issue 1
Table 3 – Attributes’ weights.
TOPSIS
Energy Delay Cost 14 Lightweight TOPSIS
0.6 0.1 0.3 12
0.1 0.8 0.1 10
Computation time (ms) 8
60 6
Rank reversal prevalence (%) 40 4 2 3 4 5 6 7 8 9 10
50
30
20 Square matrix order
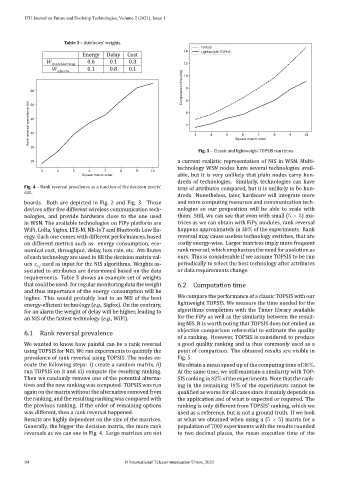
Fig. 5 – Classic and lightweight TOPSIS run times.
a current realistic representation of NIS in WSN. Multi‐
10
technology WSN nodes have several technologies avail‐
3 4 5 6 7 8 9 10
able, but it is very unlikely that plain nodes carry hun‐
Square matrix order
dreds of technologies. Similarly, technologies can have
Fig. 4 – Rank reversal prevalence as a function of the decision matrix’ tens of attributes compared, but it is unlikely to be hun‐
size.
dreds. Nonetheless, later, hardware will integrate more
boards. Both are depicted in Fig. 2 and Fig. 3. Those and more computing resources and communication tech‐
devices offer ive different wireless communication tech‐ nologies so our proposition will be able to scale with
nologies, and provide hardware close to the one used them. Still, we can see that even with small (5 × 5) ma‐
in WSN. The available technologies on FiPy platform are trices as we can obtain with FiPy modules, rank reversal
WiFi, LoRa, Sigfox, LTE‐M, NB‐IoT and Bluetooth Low En‐ happens approximately in 30% of the experiments. Rank
ergy. Each one comes with different performances, based reversal may cause useless technology switches, that are
on different metrics such as: energy consumption, eco‐ costly energy‐wise. Larger matrices imply more frequent
nomical cost, throughput, delay, loss rate, etc. Attributes rank reversal, which emphasizes the need for a solution as
of each technology are used to ill the decision matrix val‐ ours. This is considerable if we assume TOPSIS to be run
ues used as input for the NIS algorithms. Weights as‐ periodically to select the best technology after attributes
sociated to attributes are determined based on the data or data requirements change.
requirements. Table 3 shows an example set of weights
that could be used: for regular monitoring data the weight 6.2 Computation time
and thus importance of the energy consumption will be
higher. This would probably lead to an NIS of the best We compare the performance of a classic TOPSIS with our
energy‐ef icient technology (e.g., Sigfox). On the contrary, lightweight TOPSIS. We measure the time needed for the
for an alarm the weight of delay will be higher, leading to algorithms completion with the Timer library available
an NIS of the fastest technology (e.g., WiFi). for the FiPy as well as the similarity between the result‐
ing NIS. It is worth noting that TOPSIS does not embed an
objective comparison referential to estimate the quality
6.1 Rank reversal prevalence
of a ranking. However, TOPSIS is considered to produce
We wanted to know how painful can be a rank reversal a good quality ranking and is thus commonly used as a
using TOPSIS for NIS. We ran experiments to quantify the point of comparison. The obtained results are visible in
prevalence of rank reversal using TOPSIS. The nodes ex‐ Fig. 5.
ecute the following steps: i) create a random matrix, ii) We obtain a mean speed up of the computing time of 38%.
run TOPSIS on it and iii) compute the resulting ranking. At the same time, we still maintain a similarity with TOP‐
Then we randomly remove one of the potential alterna‐ SIS ranking in 82% of the experiments. Note that the rank‐
tives and the new ranking was computed. TOPSIS was run ing in the remaining 18% of the experiments cannot be
again on the matrix without the alternative removed from quali ied as worse for all cases since it mainly depends on
the ranking, and the resulting ranking was compared with the application and of what is expected or required. The
the previous ranking. If the order of remaining options ranking is only different from TOPSIS’ ranking, which we
was different, then a rank reversal happened. used as a reference, but is not a ground truth. If we look
Results are highly dependent on the size of the matrices. at what we obtained when using a (5 × 5) matrix for a
Generally, the bigger the decision matrix, the more rank population of 7000 experiments with the results rounded
reversals as we can see in Fig. 4. Large matrices are not to two decimal places, the mean execution time of the
94 © International Telecommunication Union, 2021