
Page 45 - A U4SSC deliverable - Guidelines on tools and mechanisms to finance Smart Sustainable Cities projects
P. 45
improvement of the environment through lower CO emissions, or cleaner water). These four master
2
plans should be associated with urban geographic information systems (GIS). 3
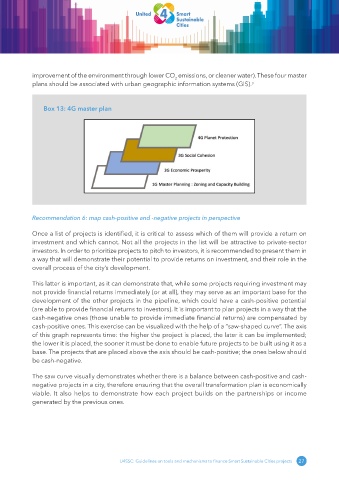
Box 13: 4G master plan
Recommendation 6: map cash-positive and -negative projects in perspective
Once a list of projects is identified, it is critical to assess which of them will provide a return on
investment and which cannot. Not all the projects in the list will be attractive to private-sector
investors. In order to prioritize projects to pitch to investors, it is recommended to present them in
a way that will demonstrate their potential to provide returns on investment, and their role in the
overall process of the city’s development.
This latter is important, as it can demonstrate that, while some projects requiring investment may
not provide financial returns immediately (or at all), they may serve as an important base for the
development of the other projects in the pipeline, which could have a cash-positive potential
(are able to provide financial returns to investors). It is important to plan projects in a way that the
cash-negative ones (those unable to provide immediate financial returns) are compensated by
cash-positive ones. This exercise can be visualized with the help of a “saw-shaped curve”. The axis
of this graph represents time: the higher the project is placed, the later it can be implemented;
the lower it is placed, the sooner it must be done to enable future projects to be built using it as a
base. The projects that are placed above the axis should be cash-positive; the ones below should
be cash-negative.
The saw curve visually demonstrates whether there is a balance between cash-positive and cash-
negative projects in a city, therefore ensuring that the overall transformation plan is economically
viable. It also helps to demonstrate how each project builds on the partnerships or income
generated by the previous ones.
U4SSC: Guidelines on tools and mechanisms to finance Smart Sustainable Cities projects 27