
Page 139 - ITU Journal, ICT Discoveries, Volume 3, No. 1, June 2020 Special issue: The future of video and immersive media
P. 139
ITU Journal: ICT Discoveries, Vol. 3(1), June 2020
ParkRunning3 To further validate LCEVC benefits with a larger
40 data set, Table 5 includes the results achieved when
encoding the Netflix El Fuente test set
37
PSNR (dB) 34 (which includes 136 video sequences) at 1080p,
using x264/x265 with the “veryslow” preset as
31
benefits for the vast majority of clips (100% and
28 anchor and base encoders. LCEVC provides BD-rate
0 15,000 30,000 45,000 60,000 99% for VMAF, 96% and 61% for PSNR), as well as
Bit rate (kbps) average and median BD-rates consistent with the
previous tests, confirming the statistical
significance of results.
100
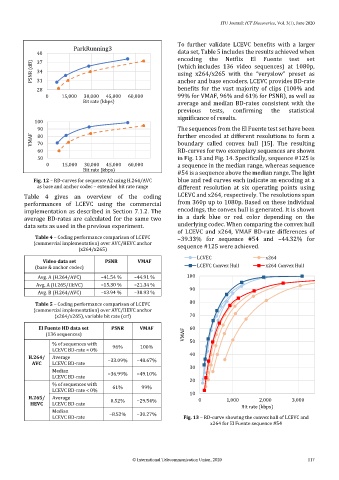
90 The sequences from the El Fuente test set have been
VMAF 80 further encoded at different resolutions to form a
boundary called convex hull [15]. The resulting
70
60 RD-curves for two exemplary sequences are shown
50 in Fig. 13 and Fig. 14. Specifically, sequence #125 is
0 15,000 30,000 45,000 60,000 a sequence in the median range, whereas sequence
Bit rate (kbps) #54 is a sequence above the median range. The light
Fig. 12 – RD-curves for sequence A2 using H.264/AVC blue and red curves each indicate an encoding at a
as base and anchor codec – extended bit rate range different resolution at six operating points using
Table 4 gives an overview of the coding LCEVC and x264, respectively. The resolutions span
performances of LCEVC using the commercial from 360p up to 1080p. Based on these individual
implementation as described in Section 7.1.2. The encodings, the convex hull is generated. It is shown
average BD-rates are calculated for the same two in a dark blue or red color depending on the
data sets as used in the previous experiment. underlying codec. When comparing the convex hull
of LCEVC and x264, VMAF BD-rate differences of
Table 4 – Coding performance comparison of LCEVC −39.33% for sequence #54 and −44.32% for
(commercial implementation) over AVC/HEVC anchor
(x264/x265) sequence #125 were achieved.
LCVEC x264
Video data set PSNR VMAF
(base & anchor codec) LCEVC Convex Hull x264 Convex Hull
Avg. A (H.264/AVC) −41.54 % −44.91 % 100
Avg. A (H.265/HEVC) −15.30 % −21.34 %
Avg. B (H.264/AVC) −13.94 % −30.93 % 90
Table 5 – Coding performance comparison of LCEVC 80
(commercial implementation) over AVC/HEVC anchor
(x264/x265), variable bit rate (crf) 70
El Fuente HD data set PSNR VMAF 60
(136 sequences) VMAF
% of sequences with 50
LCEVC BD-rate < 0% 96% 100%
H.264/ Average −33.09% −48.67% 40
AVC LCEVC BD-rate
Median −36.99% −49.10% 30
LCEVC BD-rate
% of sequences with 20
LCEVC BD-rate < 0% 61% 99% 10
H.265/ Average 0.52% −29.54% 0 1,000 2,000 3,000
HEVC LCEVC BD-rate Bit rate (kbps)
Median −8.52% −30.27%
LCEVC BD-rate Fig. 13 – RD-curve showing the convex hull of LCEVC and
x264 for El Fuente sequence #54
© International Telecommunication Union, 2020 117