
Page 135 - ITU Journal, Future and evolving technologies - Volume 1 (2020), Issue 1, Inaugural issue
P. 135
ITU Journal on Future and Evolving Technologies, Volume 1 (2020), Issue 1
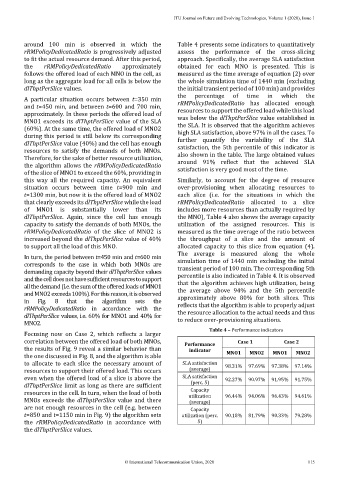
around 100 min is observed in which the Table 4 presents some indicators to quantitatively
rRMPolicyDedicatedRatio is progressively adjusted assess the performance of the cross-slicing
to fit the actual resource demand. After this period, approach. Specifically, the average SLA satisfaction
the rRMPolicyDedicatedRatio approximately obtained for each MNO is presented. This is
follows the offered load of each MNO in the cell, as measured as the time average of equation (2) over
long as the aggregate load for all cells is below the the whole simulation time of 1440 min (excluding
dlThptPerSlice values. the initial transient period of 100 min) and provides
the percentage of time in which the
A particular situation occurs between t=350 min
and t=450 min, and between t=600 and 700 min, rRMPolicyDedicatedRatio has allocated enough
resources to support the offered load while this load
approximately. In these periods the offered load of
MNO1 exceeds its dlThptPerSlice value of the SLA was below the dlThptPerSlice value established in
(60%). At the same time, the offered load of MNO2 the SLA. It is observed that the algorithm achieves
during this period is still below its corresponding high SLA satisfaction, above 97% in all the cases. To
dlThptPerSlice value (40%) and the cell has enough further quantify the variability of the SLA
resources to satisfy the demands of both MNOs. satisfaction, the 5th percentile of this indicator is
Therefore, for the sake of better resource utilisation, also shown in the table. The large obtained values
the algorithm allows the rRMPolicyDedicatedRatio around 91% reflect that the achieved SLA
of the slice of MNO1 to exceed the 60%, providing in satisfaction is very good most of the time.
this way all the required capacity. An equivalent Similarly, to account for the degree of resource
situation occurs between time t=900 min and over-provisioning when allocating resources to
t=1300 min, but now it is the offered load of MNO2 each slice (i.e. for the situations in which the
that clearly exceeds its dlThptPerSlice while the load rRMPolicyDedicatedRatio allocated to a slice
of MNO1 is substantially lower than its includes more resources than actually required by
dlThptPerSlice. Again, since the cell has enough the MNO), Table 4 also shows the average capacity
capacity to satisfy the demands of both MNOs, the utilization of the assigned resources. This is
rRMPolicyDedicatedRatio of the slice of MNO2 is measured as the time average of the ratio between
increased beyond the dlThptPerSlice value of 40% the throughput of a slice and the amount of
to support all the load of this MNO. allocated capacity to this slice from equation (4).
The average is measured along the whole
In turn, the period between t=450 min and t=600 min
corresponds to the case in which both MNOs are simulation time of 1440 min excluding the initial
demanding capacity beyond their dlThptPerSlice values transient period of 100 min. The corresponding 5th
and the cell does not have sufficient resources to support percentile is also indicated in Table 4. It is observed
all the demand (i.e. the sum of the offered loads of MNO1 that the algorithm achieves high utilization, being
and MNO2 exceeds 100%). For this reason, it is observed the average above 94% and the 5th percentile
in Fig. 8 that the algorithm sets the approximately above 80% for both slices. This
rRMPolicyDedicatedRatio in accordance with the reflects that the algorithm is able to properly adjust
dlThptPerSlice values, i.e. 60% for MNO1 and 40% for the resource allocation to the actual needs and thus
MNO2. to reduce over-provisioning situations.
Table 4 – Performance indicators
Focusing now on Case 2, which reflects a larger
correlation between the offered load of both MNOs, Performance Case 1 Case 2
the results of Fig. 9 reveal a similar behavior than indicator
the one discussed in Fig. 8, and the algorithm is able MNO1 MNO2 MNO1 MNO2
to allocate to each slice the necessary amount of SLA satisfaction 98.31% 97.69% 97.38% 97.14%
resources to support their offered load. This occurs (average)
even when the offered load of a slice is above the SLA satisfaction 92.27% 90.97% 91.95% 91.75%
dlThptPerSlice limit as long as there are sufficient (perc. 5)
Capacity
resources in the cell. In turn, when the load of both utilization 96.44% 94.06% 96.43% 94.61%
MNOs exceeds the dlThptPerSlice value and there (average)
are not enough resources in the cell (e.g. between Capacity
t=850 and t=1150 min in Fig. 9) the algorithm sets utilization (perc. 90.18% 81.79% 90.33% 79.28%
the rRMPolicyDedicatedRatio in accordance with 5)
the dlThptPerSlice values.
© International Telecommunication Union, 2020 115