
Page 134 - ITU Journal, Future and evolving technologies - Volume 1 (2020), Issue 1, Inaugural issue
P. 134
ITU Journal on Future and Evolving Technologies, Volume 1 (2020), Issue 1
offered load patterns of the two MNOs in the values, from which the SLA satisfaction ratio and
different cells during one day. They capture capacity utilization metrics are determined.
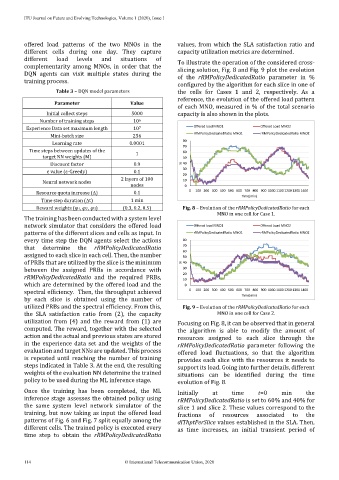
different load levels and situations of To illustrate the operation of the considered cross-
complementarity among MNOs, in order that the slicing solution, Fig. 8 and Fig. 9 plot the evolution
DQN agents can visit multiple states during the of the rRMPolicyDedicatedRatio parameter in %
training process.
configured by the algorithm for each slice in one of
Table 3 – DQN model parameters the cells for Cases 1 and 2, respectively. As a
reference, the evolution of the offered load pattern
Parameter Value
of each MNO, measured in % of the total scenario
Initial collect steps 5000 capacity is also shown in the plots.
Number of training steps 10 6
Experience Data set maximum length 10 7 Offered load MNO1 Offered Load MNO2
Mini-batch size 256 rRMPolicyDedicatedRatio MNO1 rRMPolicyDedicatedRatio MNO2
Learning rate 0.0001 80
70
Time steps between updates of the 1 60
target NN weights (M) 50
Discount factor 0.9 % 40
ɛ value (ɛ-Greedy) 0.1 30
20
2 layers of 100
Neural network nodes 10
nodes 0
Resource quota increase () 0.1 0 100 200 300 400 500 600 700 800 900 1000 1100 1200 1300 1400
Time(min)
Time step duration (t) 1 min
Reward weights (φ1, φ2 , φ3) (0.3, 0.2, 0.5) Fig. 8 – Evolution of the rRMPolicyDedicatedRatio for each
MNO in one cell for Case 1.
The training has been conducted with a system level
network simulator that considers the offered load Offered load MNO1 Offered Load MNO2
patterns of the different slices and cells as input. In rRMPolicyDedicatedRatio MNO1 rRMPolicyDedicatedRatio MNO2
every time step the DQN agents select the actions 80
that determine the rRMPolicyDedicatedRatio 70
assigned to each slice in each cell. Then, the number 60
50
of PRBs that are utilized by the slice is the minimum % 40
between the assigned PRBs in accordance with 30
rRMPolicyDedicatedRatio and the required PRBs, 20
10
which are determined by the offered load and the 0
spectral efficiency. Then, the throughput achieved 0 100 200 300 400 500 600 700 800 900 1000 1100 1200 1300 1400
by each slice is obtained using the number of Time(min)
utilized PRBs and the spectral efficiency. From this, Fig. 9 – Evolution of the rRMPolicyDedicatedRatio for each
the SLA satisfaction ratio from (2), the capacity MNO in one cell for Case 2.
utilization from (4) and the reward from (1) are Focusing on Fig. 8, it can be observed that in general
computed. The reward, together with the selected the algorithm is able to modify the amount of
action and the actual and previous states are stored resources assigned to each slice through the
in the experience data set and the weights of the rRMPolicyDedicatedRatio parameter following the
evaluation and target NNs are updated. This process offered load fluctuations, so that the algorithm
is repeated until reaching the number of training provides each slice with the resources it needs to
steps indicated in Table 3. At the end, the resulting support its load. Going into further details, different
weights of the evaluation NN determine the trained situations can be identified during the time
policy to be used during the ML inference stage. evolution of Fig. 8.
Once the training has been completed, the ML Initially at time t=0 min the
inference stage assesses the obtained policy using rRMPolicyDedicatedRatio is set to 60% and 40% for
the same system level network simulator of the slice 1 and slice 2. These values correspond to the
training, but now taking as input the offered load fractions of resources associated to the
patterns of Fig. 6 and Fig. 7 split equally among the dlThptPerSlice values established in the SLA. Then,
different cells. The trained policy is executed every as time increases, an initial transient period of
time step to obtain the rRMPolicyDedicatedRatio
114 © International Telecommunication Union, 2020