
Page 37 - ITU Journal: Volume 2, No. 1 - Special issue - Propagation modelling for advanced future radio systems - Challenges for a congested radio spectrum
P. 37
ITU Journal: ICT Discoveries, Vol. 2(1), December 2019
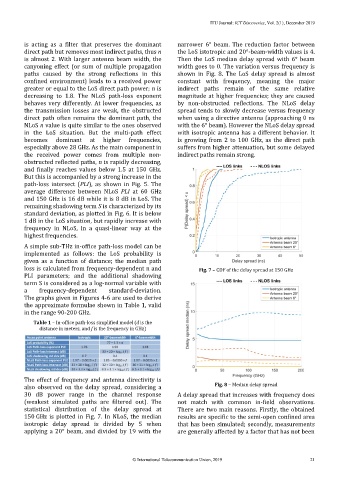
is acting as a filter that preserves the dominant narrower 6° beam. The reduction factor between
direct path but removes most indirect paths, thus n the LoS istotropic and 20°-beam-width values is 4.
is almost 2. With larger antenna beam width, the Then the LoS median delay spread with 6° beam
canyoning effect (or sum of multiple propagation width goes to 0. The variation versus frequency is
paths caused by the strong reflections in this shown in Fig. 8. The LoS delay spread is almost
confined environment) leads to a received power constant with frequency, meaning the major
greater or equal to the LoS direct path power; n is indirect paths remain of the same relative
decreasing to 1.8. The NLoS path-loss exponent magnitude at higher frequencies; they are caused
behaves very differently. At lower frequencies, as by non-obstructed reflections. The NLoS delay
the transmission losses are weak, the obstructed spread tends to slowly decrease versus frequency
direct path often remains the dominant path, the when using a directive antenna (approaching 0 ns
NLoS n value is quite similar to the ones observed with the 6° beam). However the NLoS delay spread
in the LoS situation. But the multi-path effect with isotropic antenna has a different behavior. It
becomes dominant at higher frequencies, is growing from 2 to 100 GHz, as the direct path
especially above 28 GHz. As the main component in suffers from higher attenuation, but some delayed
the received power comes from multiple non- indirect paths remain strong.
obstructed reflected paths, n is rapidly decreasing,
and finally reaches values below 1.5 at 150 GHz.
But this is accompanied by a strong increase in the
path-loss intersect (PLI), as shown in Fig. 5. The
average difference between NLoS PLI at 60 GHz
and 150 GHz is 16 dB while it is 8 dB in LoS. The
remaining shadowing term S is characterized by its
standard deviation, as plotted in Fig. 6. It is below
1 dB in the LoS situation, but rapidly increase with
frequency in NLoS, in a quasi-linear way at the
highest frequencies.
A simple sub-THz in-office path-loss model can be
implemented as follows: the LoS probability is
given as a function of distance; the median path
loss is calculated from frequency-dependent n and Fig. 7 – CDF of the delay spread at 150 GHz
PLI parameters; and the additional shadowing
term S is considered as a log-normal variable with
a frequency-dependent standard-deviation.
The graphs given in Figures 4-6 are used to derive
the approximate formulae shown in Table 1, valid
in the range 90-200 GHz.
Table 1 – In-office path-loss simplified model (d is the
distance in meters, and f is the frequency in GHz)
The effect of frequency and antenna directivity is
also observed on the delay spread, considering a Fig. 8 – Median delay spread
30 dB power range in the channel response A delay spread that increases with frequency does
(weakest simulated paths are filtered out). The not match with common in-field observations.
statistical distribution of the delay spread at There are two main reasons. Firstly, the obtained
150 GHz is plotted in Fig. 7. In NLoS, the median results are specific to the semi-open confined area
isotropic delay spread is divided by 5 when that has been simulated; secondly, measurements
applying a 20° beam, and divided by 19 with the are generally affected by a factor that has not been
© International Telecommunication Union, 2019 21