
Page 35 - ITU Journal: Volume 2, No. 1 - Special issue - Propagation modelling for advanced future radio systems - Challenges for a congested radio spectrum
P. 35
ITU Journal: ICT Discoveries, Vol. 2(1), December 2019
propagation length inside the foliage. The towards the best propagation path (either direct or
diffraction losses are given by the knife-edge indirect). The user is equipped with an isotropic
approximation. The VolcanoUrban technology has antenna in all three cases. The simulations are
recently been updated to support LiDAR point performed at various frequencies from 2 to
cloud data. This enables far more accurate 3D 200 GHz in order to observe the channel evolution
representation of the trees’ foliage and street from medium cellular frequency bands to sub-THz
furniture compared to conventional geographical bands.
databases. Therefore, the prediction of the 3.2 In-street scenario
transmission losses and blockage is made much
closer to reality [11]. Prediction and characterization of the outdoor sub-
THz propagation channel are conducted for urban
3. SCENARIO AND SET-UP fixed backhaul links at street level, typically for
antennas installed at lamp-post height. LiDAR
The Volcano technology described in section 2 has
been utilized in an indoor office scenario, and a representation and ray-based multi-paths are
street-level outdoor case study at sub-THz together exploited to assess the impact of building
frequencies, details of which are described next. and vegetation obstructions.
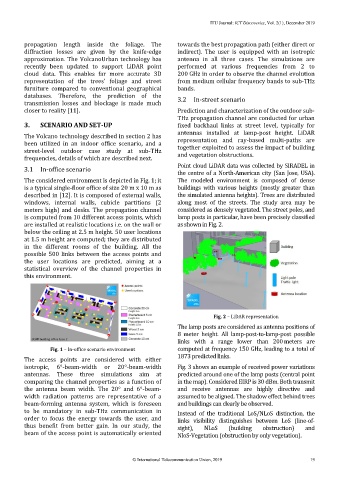
Point cloud LiDAR data was collected by SIRADEL in
3.1 In-office scenario
the centre of a North-American city (San Jose, USA).
The considered environment is depicted in Fig. 1; it The modeled environment is composed of dense
is a typical single-floor office of size 20 m x 10 m as buildings with various heights (mostly greater than
described in [12]. It is composed of external walls, the simulated antenna heights). Trees are distributed
windows, internal walls, cubicle partitions (2 along most of the streets. The study area may be
meters high) and desks. The propagation channel considered as densely vegetated. The street poles, and
is computed from 10 different access points, which lamp posts in particular, have been precisely classified
are installed at realistic locations i.e. on the wall or as shown in Fig. 2.
below the ceiling at 2.5 m height. 50 user locations
at 1.5 m height are computed; they are distributed
in the different rooms of the building. All the
possible 500 links between the access points and
the user locations are predicted, aiming at a
statistical overview of the channel properties in
this environment.
Fig. 2 – LiDAR representation
The lamp posts are considered as antenna positions of
8 meter height. All lamp-post-to-lamp-post possible
links with a range lower than 200 meters are
Fig. 1 – In-office scenario environment computed at frequency 150 GHz, leading to a total of
1873 predicted links.
The access points are considered with either
isotropic, 6°-beam-width or 20°-beam-width Fig. 3 shows an example of received power variations
antennas. These three simulations aim at predicted around one of the lamp posts (central point
comparing the channel properties as a function of in the map). Considered EIRP is 30 dBm. Both transmit
the antenna beam width. The 20° and 6°-beam- and receive antennas are highly directive and
width radiation patterns are representative of a assumed to be aligned. The shadow effect behind trees
beam-forming antenna system, which is foreseen and buildings can clearly be observed.
to be mandatory in sub-THz communication in Instead of the traditional LoS/NLoS distinction, the
order to focus the energy towards the user, and links visibility distinguishes between LoS (line-of-
thus benefit from better gain. In our study, the sight), NLoS (building obstruction) and
beam of the access point is automatically oriented NloS-Vegetation (obstruction by only vegetation).
© International Telecommunication Union, 2019 19