
Page 128 - Proceedings of the 2018 ITU Kaleidoscope
P. 128
2018 ITU Kaleidoscope Academic Conference
Figure 6 – ADS-B Signal.
Figure 7 – Manchester codification.
400km above the earth surface. A specific gain was assigned
to each aircraft-to-satellite channel[10]. For the simulated
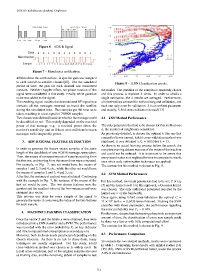
Figure 8 – 11NN Classification results.
period of time, the gain for each channel was considered
constant. Neither Doppler effect, nor phase rotation of the the model. The partition of the samples is randomly chosen
signal were considered in this study. Finally, white gaussian and this process is repeated k times. In order to obtain a
noise was added to the signal. single estimation, the k results are averaged. Furthermore,
The resulting signal models the demodulated RF signal that all observations are used for both training and validation, and
contains all the messages received on-board the satellite each one only once for validation. k is an unfixed parameter
during the simulation time. Two samples per bit time were and usually, 5-fold cross-validation is used.[13].
taken, resulting in a test signal of 760000 samples.
Two classes were defined based on whether the message could 4.1 kNN Method Performance
be decodified or not. This mainly depended on the received
power of that message -e.g. a received power above the The only parameter that had to be chosen for this method was
receiver’s sensitivity- and on if there were collisions between k, the number of neighbours considered.
messages with comparable power. As previously detailed, to choose the optimal k (the one that
committed fewer errors), k-fold cross-validation method was
3. ADS-B SIGNAL FEATURE EXTRACTION employed. It was obtained a P e = 0.059 for k = 11.
As there is no actual learning process before the search, the
In order to generate the feature vector, samples of the same complete training dataset was one of the inputs of the machine
length of the data block of one ADS-B message, were taken. and could not be reduced. It is important to be aware that
Then, the means of consecutive pair of samples starting from every search takes non-neglectable time to compute its result,
the first one, and starting from the second one were computed. even when code optimization techniques are applied.
For example, in Fig. 7, one set would have the means of The contour for this method is shown in Fig. 8.
samples 1 and 2, 3 and 4, etc., while the other set would have
the means of samples 2 and 3, 4 and 5, etc.
4.2 SVM Method Performance
After that, the variance of each set was calculated. Continuing
with the example in Fig. 7, the variance of the means of the For this method, two main parameters had to be set; C of eq.
first set would be zero. The two chosen features were the (5) and the kernel used. For this approach, a Gaussian kernel
greatest and the smallest value of the two variances and were was chosen. The only additional parameter required by the
arranged in a vector. kernel was σ or the bandwidth.
This process was done for every sample of the signal to Once again, using k-fold cross-validation the optimal C =
generate the vector ® x containing the value of the two features 11 × 10 and σ = 0.0433 were obtained. Training the SVM
5
for each sample. classifier with those parameters, the performance regarding
the error probability was P e = 0.049.
4. MACHINE LEARNING CLASSIFICATION
Furthermore, despite that the training phase took an important
amount of time, the classification of every new sample could
Once the vector ® x and the labels y were obtained, they were
be done very fast or with little computational effort.
introduced into a kNN classifier and a SVM. The performance
The contour for this method is shown in Fig. 9.
was recorded with the error probability P e as key indicator
and time/computational consumption as secondary one.
4.3 Performance Comparison
Moreover, both methods needs parameters depending on the
chosen structure. As there is no rule to chose them, many
To evaluate the two studied methods, results were condensed
techniques are usually employed. For this study, k-fold
in table 1. Comparing those results with similar studies [14]
cross-validation method was chosen as is widely used. In
[15] [16], kNN or SVM performed better, under the spacial
k-fold cross-validation, part of the original samples are used
ADS-B circumstances.
as training data, and the remaining subset of samples to test
– 112 –