
Page 76 - ITU Journal - ICT Discoveries - Volume 1, No. 2, December 2018 - Second special issue on Data for Good
P. 76
ITU JOURNAL: ICT Discoveries, Vol. 1(2), December 2018
Fig. 4 – iSTARS architecture
One example from iSTARS applications is Air
Transport Accessibility. It assesses the physical
access of people to the nearest airports. The Fig. 6 – Air Transport Accessibility application interface.
inspiration came from the UN SDG 9.1.1 [13]. This
notion of accessibility was extended to the air ICAO also supports the API (application
transport system to determine which ICAO Member programming interface) data services for users who
States are the least connected to the aviation want to access raw data. The ICAO API Data Service
network and thus could be candidates for assistance. (APIDS) is a website containing a catalogue of over
The assumption here is that similar to roads, 50 datasets. The users can request a free key to
airports connect people to the world and generates query or download the available datasets.
positive economic impact.
Fig. 5 – Data transformation for air transport connectivity
application
The 2015 “Gridded Population of the World”
dataset from the Socioeconomic Data and
Applications Center (SEDEAC) [14] was used for
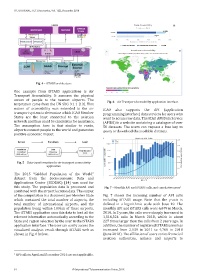
this study. The population data is processed and Fig. 7 – Monthly API and iSTARS calls, and cumulative users
1
combined with the airport location data. The output
of the computation is a document per Member State Fig. 7 shows the incresing number of API calls
which contained the total number of airports, the including iSTARS usage. Note that the y-axis is
total number of international airports, and the defined in a logarithmic scale with base 10. The
population living within 100km of these airports. monthly API and iSTARS calls were 6,679 in March,
The iSTARS application uses this data to load all the 2016. In 2 years, the calls were sharply increased to
relevant information automatically according to the 1,516,324 calls in March 2018, which is about
State and region selection by the user in the iSTARS 227 times larger than the calls from 2 years ago. In
application interface. The user can easily access the addition, the number of registered iSTARS users has
visualized analysis result through iSTARS web as increased from 2,139 in 2011 to 4,700 in 2018
shown in Fig. 6 below. (June 2018). The affiliation of users varies from civil
aviation authorities, airlines and airports to
1 API calls in April and December 2016 are not applicable.
54 © International Telecommunication Union, 2018