
Page 775 - 5G Basics - Core Network Aspects
P. 775
Transport aspects 2
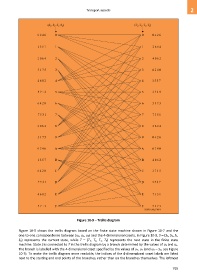
Figure 10-9 – Trellis diagram
Figure 10-9 shows the trellis diagram based on the finite state machine shown in Figure 10-7 and the
one-to-one correspondence between (u2, u1, u0) and the 4-dimensional cosets. In Figure 10-9, S (S3, S2, S1,
S0) represents the current state, while T (T3, T2, T1, T0) represents the next state in the finite state
machine. State S is connected to T in the trellis diagram by a branch determined by the values of u2 and u1.
The branch is labelled with the 4-dimensional coset specified by the values of u2, u1 (and u0 S0, see Figure
10-7). To make the trellis diagram more readable, the indices of the 4-dimensional coset labels are listed
next to the starting and end points of the branches, rather than on the branches themselves. The leftmost
765