
Page 625 - 5G Basics - Core Network Aspects
P. 625
Transport aspects 2
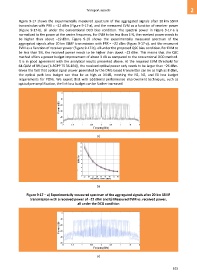
Figure 9-17 shows the experimentally measured spectrum of the aggregated signals after 20 km SSMF
transmission with PRX = –22 dBm (Figure 9-17-a), and the measured EVM as a function of receiver power
(Figure 9-17-b), all under the conventional DCO bias condition. The spectral power in Figure 9-17-a is
normalized to the power at the centre frequency. For EVM to be less than 5 %, the received power needs to
be higher than about –19 dBm. Figure 9-18 shows the experimentally measured spectrum of the
aggregated signals after 20 km SSMF transmission with PRX = –22 dBm (Figure 9-17-a), and the measured
EVM as a function of receiver power (Figure 9-17-b), all under the proposed QSC bias condition. For EVM to
be less than 5%, the received power needs to be higher than about –22 dBm. This means that the QSC
method offers a power budget improvement of about 3 dB as compared to the conventional DCO method.
It is in good agreement with the analytical results presented above. At the required EVM threshold for
64-QAM of 8% (see [b-3GPP TS 36.104]), the received optical power only needs to be larger than −26 dBm.
Given the fact that optical signal power generated by the DML-based transmitter can be as high as 8 dBm,
the optical path loss budget can thus be as high as 34 dB, meeting the N1, N2, and E1 loss budget
requirements for PONs. We expect that with additional performance improvement techniques, such as
optical pre-amplification, the link loss budget can be further increased.
a)
b)
Figure 9-17 – a) Experimentally measured spectrum of the aggregated signals after 20 km SSMF
transmission with a received power of –22 dBm and b) Measured EVM vs. received power,
all under the DCO condition
a)
615