
Page 922 - Shaping smarter and more sustainable cities - Striving for sustainable development goals
P. 922
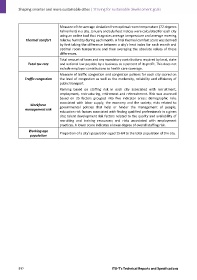
Measure of the average deviation from optimal room temperature (72 degrees
                                     Fahrenheit) in a city. January and July heat indices were calculated for each city
                                     using an online tool that integrates average temperature and average morning
                 Thermal comfort     relative humidity during each month. A final thermal comfort score was derived
                                     by first taking the difference between a city's heat index for each month and
                                     optimal room temperature and then averaging the absolute values of these
                                     differences.
                                     Total amount of taxes and any mandatory contributions required by local, state
                  Total tax rate     and national law payable by a business as a percent of its profit. This does not
                                     include employer contributions to health care coverage.
                                     Measure of traffic congestion and congestion policies for each city scored on
                Traffic congestion   the level of congestion as well as the modernity, reliability and efficiency of
                                     public transport.
                                     Ranking  based  on  staffing  risk  in  each  city  associated  with  recruitment,
                                     employment, restructuring, retirement and retrenchment. Risk was assessed
                                     based  on  25  factors  grouped  into  five  indicator  areas:  demographic  risks
                                     associated  with  labor  supply,  the  economy  and  the  society;  risks  related  to
                   Workforce         governmental  policies  that  help  or  hinder  the  management  of  people;
                management risk
                                     education risk factors associated with finding qualified professionals in a given
                                     city; talent development risk factors related to the quality and availability of
                                     recruiting  and  training  resources;  and  risks  associated  with  employment
                                     practices. A lower score indicates a lower degree of overall staffing risk.

                  Working age
                                     Proportion of a city's population aged 15‐64 to the total population of the city.
                   population


            912                                                      ITU‐T's Technical Reports and Specifications