Page 879 - Shaping smarter and more sustainable cities - Striving for sustainable development goals
P. 879

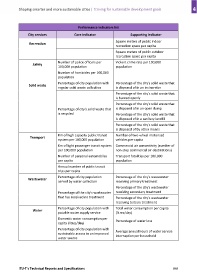
Performance indicators list
                  City services               Core indicator                    Supporting indicator

                                                                       Square meters of public indoor
                   Recreation
                                                                       recreation space per capita
                                                                       Square meters of public outdoor

                                                                       recreation space per capita
                                    Number of police officers per      Violent crime rate per 100,000
                     Safety
                                    100,000 population                 population
                                    Number of homicides per 100,000

                                    population
                                    Percentage of city population with   Percentage of the city's solid waste that
                  Solid waste
                                    regular solid waste collection     is disposed of in an incinerator
                                                                       Percentage of the city's solid waste that

                                                                       is burned openly
                                                                       Percentage of the city's solid waste that

                                    Percentage of city's solid waste that   is disposed of in an open dump
                                    is recycled                        Percentage of the city's solid waste that

                                                                       is disposed of in a sanitary landfill
                                                                       Percentage of the city's solid waste that

                                                                       is disposed of by other means
                                    Km of high capacity public transit   Number of two‐wheel motorized
                   Transport
                                    system per 100,000 population      vehicles per capita
                                    Km of light passenger transit system  Commercial air connectivity (number of

                                    per 100,000 population             non‐stop commercial air destinations)
                                    Number of personal automobiles     Transport fatalities per 100,000

                                    per capita                         population
                                    Annual number of public transit

                                    trips per capita
                                    Percentage of city population      Percentage of the city's wastewater
                  Wastewater
                                    served by water collection         receiving primary treatment
                                                                       Percentage of the city's wastewater

                                    Percentage of the city's wastewater   receiving secondary treatment
                                    that has received no treatment     Percentage of the city's wastewater

                                                                       receiving tertiary treatment
                                    Percentage of city population with   Total water consumption per capita
                     Water
                                    potable water supply service       (litres/day)
                                    Domestic water consumption per
                                                                       Percentage of water loss
                                    capita (litres/day)
                                    Percentage of city population with
                                    sustainable access to an improved   Average annual hours of water service
                                                                       interruption per household
                                    water source


            ITU‐T's Technical Reports and Specifications                                                  869
   874   875   876   877   878   879   880   881   882   883   884