
Page 878 - Shaping smarter and more sustainable cities - Striving for sustainable development goals
P. 878
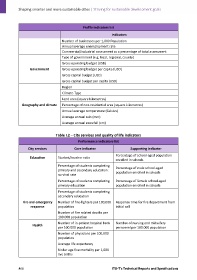
Profile indicators list
                                                                     Indicators

                                       Number of businesses per 1,000 Population
                                       Annual average unemployment rate
                                       Commercial/industrial assessment as a percentage of total assessment
                                       Type of government (e.g. local, regional, county)
                                       Gross operating budget (USD)
                   Government          Gross operating budget per capita (USD)

                                       Gross capital budget (USD)
                                       Gross capital budget per capita (USD)
                                       Region
                                       Climate Type

                                       Land area (square kilometres)
              Geography and climate    Percentage of non‐residential area (square kilometres)
                                       Annual average temperature (Celsius)
                                       Average annual rain (mm)

                                       Average annual snowfall (cm)

                                   Table I.2 – City services and quality of life indicators
                                                Performance indicators list

                  City services               Core indicator                    Supporting indicator

                                                                       Percentage of school‐aged population
                   Education        Student/teacher ratio
                                                                       enrolled in schools
                                    Percentage of students completing
                                                                       Percentage of male school‐aged
                                    primary and secondary education:
                                                                       population enrolled in schools
                                    survival rate
                                    Percentage of students completing   Percentage of female school‐aged
                                    primary education                  population enrolled in schools

                                    Percentage of students completing

                                    secondary education
               Fire and emergency   Number of fire‐fighters per 100,000   Response time for fire department from
                    response        population                         initial call
                                    Number of fire related deaths per

                                    100.000 population
                                    Number of in‐patient hospital beds   Number of nursing and midwifery
                     Health
                                    per 100.000 population             personnel per 100.000 population
                                    Number of physicians per 100,000

                                    population
                                    Average life expectancy
                                    Under age five mortality per 1,000

                                    live births


            868                                                      ITU‐T's Technical Reports and Specifications