
Page 873 - Shaping smarter and more sustainable cities - Striving for sustainable development goals
P. 873
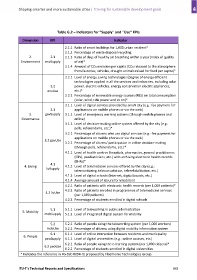
Table G.2 – Indicators for "Supply" and "Use" KPIs

               Dimension       KPI                                    Indicator

                                        2.1.1  Ratio of smart buildings for 1,000 urban resident*
                                        2.1.2  Percentage of waste disposal recycling
                   2.           2.1     2.1.3  Ratio of days of healthy air breathing within a year (index of quality
              Environment   envSupply         of air)*
                                        2.1.4  Amount of CO2 emission per capita (CO2 released to the atmosphere
                                              from factories, vehicles, draught animals raised for food per capita)*
                                        2.2.1  Level of energy saving technologies (degree of energy efficient
                                              technologies applied in all the services and industries, including solar
                                2.2           power, electric vehicles, energy conservation electric appliances,

                              envUse          etc.)*
                                        2.2.2  Percentage of renewable energy sources (RES) on total consumption
                                              (solar, wind, tide power and so on)*
                                        3.1.1  Level of digital services provided by smart city (e.g.: fee payment for
                                3.1           applications on mobile phones or via the web)
                   3.       govSupply   3.1.2  Level of emergency warning systems (through mobile phones and
              Governance                      online)
                                        3.1.3  Level of decision‐making online system offered by the city (e.g.:
                                              polls, referendums, etc.)*
                                        3.2.1  Percentage of citizens who use digital services (e.g.: fee payment for
                                              applications on mobile phones or via the web)
                            3.2 govUse
                                        3.2.2  Percentage of citizens' participation in online decision‐making
                                              (through polls, referendums, etc.)*
                                        4.1.1  Level of health centres (hospitals, pharmacies, general practitioners
                                              (GPs), paediatricians, etc.) with archiving electronic health records
                                              (EHRs)*
                                4.1
                4. Living               4.1.2  Level of telemedicine services offered by the city (e.g.:
                             livSupply
                                              telemonitoring, teleconsultation, telerehabilitation, etc.)
                                        4.1.3  Level of digital schools (Internet, digital boards, etc.)
                                        4.1.4  Average amount of leisure for inhabitant
                                        4.2.1  Ratio of patients with electronic health records (per 1,000 patients)*
                                        4.2.2  Ratio of patients enrolled in programmes of telemedicine services
                             4.2 livUse
                                              (per 1,000 patients)
                                        4.2.3  Percentage of students enrolled in digital schools


                                5.1     5.1.1  Level of teleworking in public administration
               5. Mobility
                            mobSupply  5.1.2  Level of integrated digital system for mobility


                                5.2     5.2.1  Ratio of people using the teleworking system (per 1,000 workers)

                             mobUse     5.2.2  Percentage of citizens using digital mobility information system
                                6.1     6.1.1  Level of online interaction between residents and municipality
               6. People
                            peoSupply   6.1.2  Level of digital universities (e.g.: online courses, etc.)
                                        6.2.1  Ratio of people using the e‐learning system (per 1,000 citizens)*
                            6.2 peoUse
                                        6.2.2  Percentage of students enrolled in digital universities
             * Indicates the reference in FG‐SSC‐0094‐r1 proposed by Fiberhome Technologies Group.


            ITU‐T's Technical Reports and Specifications                                                  863