
Page 872 - Shaping smarter and more sustainable cities - Striving for sustainable development goals
P. 872
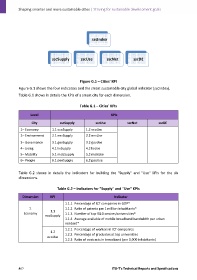
sscIndex


                                 sscSupply        sscUse          sscNet          sscDE


                                                 Figure G.1 – Cities' KPI
            Figure G.1 shows the four indicators and the smart sustainable city global indicator (sscIndex).

            Table G.1 shows in details the KPIs of a smart city for each dimension.


                                                 Table G.1 – Cities' KPIs


                    Level                                           KPIs

                    City             sscSupply             sscUse             sscNet             sscDE
             1– Economy          1.1 ecoSupply       1.2 ecoUse
             2– Environment      2.1 envSupply       2.2 envUse

             3– Governance       3.1 govSupply       3.2 govUse
             4– Living           4.1 livSupply       4.2 livUse
             5– Mobility         5.1 mobSupply       5.2 mobUse

             6– People           6.1 peoSupply       6.2 peoUse

            Table  G.2  shows  in  details  the  indicators  for  building  the  "Supply"  and  "Use"  KPIs  for  the  six
            dimensions.


                                    Table G.2 – Indicators for "Supply" and "Use" KPIs

               Dimension       KPI                                    Indicator

                                        1.1.1  Percentage of ICT companies in GDP*
                   1.                   1.1.2  Ratio of patents per 1 million inhabitants*
                                1.1
               Economy                  1.1.3  Number of top R&D centres/universities*
                            ecoSupply
                                        1.1.4  Average available of mobile broadband bandwidth per urban
                                        resident*

                                        1.2.1  Percentage of workers in ICT companies
                                1.2
                                        1.2.2  Percentage of graduates at top universities
                              ecoUse
                                        1.2.3  Ratio of contracts in broadband (per 1,000 inhabitants)


            862                                                      ITU‐T's Technical Reports and Specifications