
Page 602 - Shaping smarter and more sustainable cities - Striving for sustainable development goals
P. 602
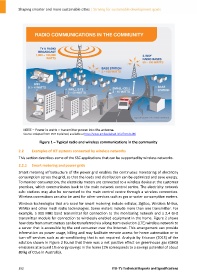
NOTE – Power in watts = transmitter power into the antenna.
               Source: Adapted from EMF Explained, available at http://www.emfexplained.info/?ID=25186

                         Figure 1 – Typical radio and wireless communications in the community

            2.2     Examples of ICT systems connected by wireless networks

            This section describes some of the SSC applications that can be supported by wireless networks.

            2.2.1   Smart metering and power grids
            Smart metering infrastructure of the power grid enables the continuous monitoring of electricity
            consumption across the grid, so that the loads and distribution can be optimized and save energy.
            To monitor consumption, the electricity meters are connected to a wireless device at the customer
            premises, which communicates back to the main network control centre. The electricity network
            sub‐ stations may also be connected to the main control centre through a wireless connection.
            Wireless connections can also be used for other services such as gas or water consumption meters.

            Wireless technologies that are used for smart metering include cellular, ZigBee, Wireless M‐Bus,
            WiMax and other mesh radio technologies. Some meters include more than one transmitter. For
            example, a 900 MHz band transmitter for connection to the monitoring network and a 2.4 GHz
            transmitter module for connection to wirelessly enabled equipment in the home. Figure 2 shows
            how data from smart meters can be transferred via a long‐term evolution (LTE) wireless network to
            a server that is accessible by the end consumer over the Internet. This arrangement can provide
            information on power usage, billing and may facilitate remote access for home automation or to
            turn‐off services such as air‐conditioning that is not required. Analysis by Ericsson (2013) of the
            solution shown in Figure 2 found that there was a net positive effect on greenhouse gas (GHG)
            emissions at around 1% energy savings in the home (1% corresponds to a savings potential of about
            80 kg of CO2e in Australia).


            592                                                      ITU‐T's Technical Reports and Specifications