
Page 97 - Implementing ITU-T International Standards to Shape Smart Sustainable Cities: The Case of Dubai
P. 97
I: Core KPI
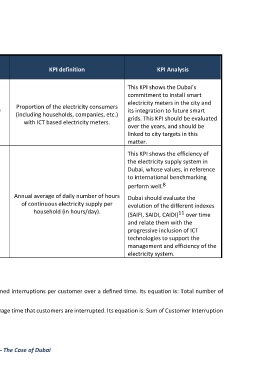
Sub-dimension o Indicator KPI definition KPI Analysis
A: Additional N
This KPI shows the Dubai’s
commitment to install smart
electricity meters in the city and
Proportion of the electricity consumers
Availability of smart electricity its integration to future smart
I 631 (including households, companies, etc.)
meters grids. This KPI should be evaluated
with ICT based electricity meters.
over the years, and should be
linked to city targets in this
matter.
This KPI shows the efficiency of
D6.3 Infrastructure/ the electricity supply system in
connection to services Dubai, whose values, in reference
– electricity to international benchmarking
8
perform well.
Annual average of daily number of hours
I6.3.2 Reliability of electricity Dubai should evaluate the
I 632 of continuous electricity supply per evolution of the different indexes
supply system
household (in hours/day). 11
(SAIFI, SAIDI, CAIDI) over time
and relate them with the
progressive inclusion of ICT
technologies to support the
management and efficiency of the
electricity system.
11 SAIDI: System Average Interruption Frequency Index, provides frequency of sustained interruptions per customer over a defined time. Its equation is: Total number of
customer interruptions/ Total number of customers served.
SAIFI: System Average Interruption Duration Index, provides information on the average time that customers are interrupted. Its equation is: Sum of Customer Interruption
duration / Total number of customers served.
69 Implementing ITU-T International Standards to Shape Smart Sustainable Cities – The Case of Dubai