
Page 34 - Preliminary Analysis Towards a Standardized Readiness Framework - Interim Report
P. 34
Preliminary Analysis Towards a Standardized Readiness Framework
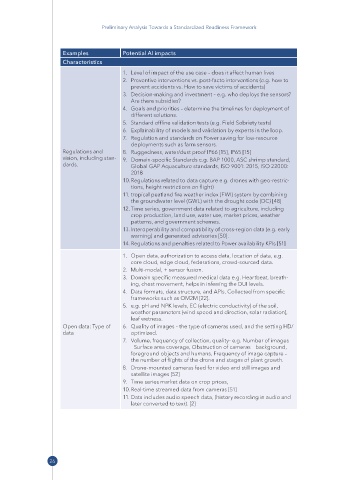
Examples Potential AI impacts
Characteristics
1. Level of impact of the use case – does it affect human lives
2. Preventive interventions vs. post-facto interventions (e.g. how to
prevent accidents vs. How to save victims of accidents)
3. Decision-making and investment – e.g. who deploys the sensors?
Are there subsidies?
4. Goals and priorities – determine the timelines for deployment of
different solutions.
5. Standard offline validation tests (e.g. Field Sobriety tests)
6. Explainability of models and validation by experts in the loop.
7. Regulation and standards on Power saving for low-resource
deployments such as farm sensors.
Regulations and 8. Ruggedness, water/dust proof IP66 [15], IP65 [15]
vision, including stan- 9. Domain-specific Standards e.g. BAP 1000, ASC shrimp standard,
dards. Global GAP Aquaculture standards, ISO 9001: 2015, ISO 22000:
2018
10. Regulations related to data capture e.g. drones with geo-restric-
tions, height restrictions on flight)
11. tropical peatland fire weather index (FWI) system by combining
the groundwater level (GWL) with the drought code (DC) [48]
12. Time series, government data related to agriculture, including
crop production, land use, water use, market prices, weather
patterns, and government schemes.
13. Interoperability and compatibility of cross-region data (e.g. early
warning) and generated advisories [50].
14. Regulations and penalties related to Power availability KPIs [51]
1. Open data, authorization to access data, location of data, e.g.
core cloud, edge cloud, federations, crowd-sourced data.
2. Multi-modal, + sensor fusion.
3. Domain specific measured medical data e.g. Heartbeat, breath-
ing, chest movement, helps in inferring the DUI levels.
4. Data formats, data structure, and APIs. Collected from specific
frameworks such as OM2M [22].
5. e.g. pH and NPK levels, EC (electric conductivity) of the soil,
weather parameters (wind speed and direction, solar radiation),
leaf wetness.
Open data: Type of 6. Quality of images – the type of cameras used, and the setting HD/
data optimized.
7. Volume, frequency of collection, quality- e.g. Number of images
- Surface area coverage, Obstruction of cameras – background,
foreground objects and humans, Frequency of image capture –
the number of flights of the drone and stages of plant growth.
8. Drone-mounted cameras feed for video and still images and
satellite images [52]
9. Time series market data on crop prices,
10. Real-time streamed data from cameras [51]
11. Data includes audio speech data, (history recording in audio and
later converted to text). [2]
26