
Page 478 - Kaleidoscope Academic Conference Proceedings 2024
P. 478
2024 ITU Kaleidoscope Academic Conference
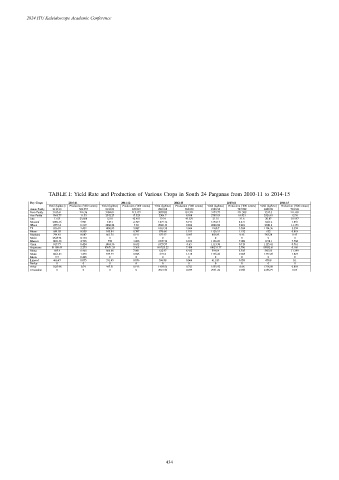
TABLE I: Yield Rate and Production of Various Crops in South 24 Parganas from 2010-11 to 2014-15
Dry Crops 2010-11 2011-12 2012-13 2013-14 2014-15
Yield (kg/hect) Production (’000 tonnes) Yield (kg/hect) Production (’000 tonnes) Yield (kg/hect) Production (’000 tonnes) Yield (kg/hect) Production (’000 tonnes) Yield (kg/hect) Production (’000 tonnes)
Aman Paddy 2110.23 302.957 2136.03 329.019 2216.68 364.032 2360.94 747.982 2440.98 794.541
Boro Paddy 3167.61 216.36 3184.01 215.172 3007.83 181.321 3172.77 231.508 3335.3 211.431
Aus Paddy 1968.77 11.33 2342.27 17.323 2304.7 8.958 2707.83 10.921 2526.81 12.76
Jute 11.55 23.608 12.81 42.401 19.34 49.329 21.15 31.6 20.87 10.997
Mustard 2082.36 5.901 538.1 2.709 1479.12 8.191 1394.15 4.477 1263.2 7.851
Wheat 2557.4 6.519 3060.84 7.56 2920.19 9.894 2840.08 9.881 2940.8 11.375
Til 936.92 2.432 1068.95 2.987 1063.38 2.604 1260.7 3.384 1134.36 3.374
Musur 684.59 0.599 543.94 0.707 978.68 1.181 1126.51 1.152 632 0.818
Maskalai 744.48 0.087 661.75 0.191 677.97 0.047 803.85 0.43 783.28 0.47
Maize 2525.94 0.134 0 0 0 0 0 0 0 0
Khesari 1403.56 4.736 792 3.206 1099.74 6.653 1156.29 7.008 1158.1 7.762
Gram 917.77 0.424 1063.36 0.632 1055.57 0.63 1113.38 0.719 1125.41 0.761
Sugarcane 81190.44 2.273 87671.24 7.368 101323.22 7.498 100231.77 2.706 93032.61 0.186
Mung 693.4 6.468 606.05 7.001 612.97 8.432 594.04 8.535 585.83 11.399
Matar 1263.43 1.498 879.79 0.825 693.4 1.138 1156.26 0.045 1197.25 1.827
Mesta 9.7 0.446 0 0 0 0 0 0 0 0
Linseed 466.47 0.075 351.45 0.056 396.98 0.064 411.83 0.059 479.8 0.1
Barley 0 0 0 0 0 0 0 0 0 0
Arhar 1625.98 0.74 447.51 0.195 1403.56 0.721 1555.92 0.68 1718.98 0.884
Groundnut 0 0 0 0 2921.56 0.079 2951.22 0.056 2156.79 0.05
– 434 –