
Page 459 - Kaleidoscope Academic Conference Proceedings 2024
P. 459
Innovation and Digital Transformation for a Sustainable World
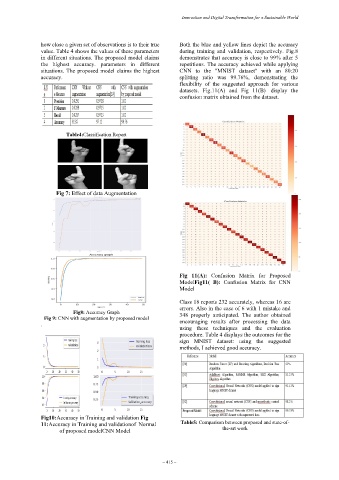
how close a given set of observations is to their true Both the blue and yellow lines depict the accuracy
value. Table 4 shows the values of these parameters during training and validation, respectively. Fig.8
in different situations. The proposed model claims demonstrates that accuracy is close to 99% after 5
the highest accuracy. parameters in different repetitions. The accuracy achieved while applying
situations. The proposed model claims the highest CNN to the "MNIST dataset" with an 80:20
accuracy. splitting ratio was 99.76%, demonstrating the
flexibility of the suggested approach for various
datasets. Fig.11(A) and Fig 11(B) display the
confusion matrix obtained from the dataset.
Table4:Classification Report
Fig 7: Effect of data Augmentation
Fig 11(A): Confusion Matrix for Proposed
ModelFig11( B): Confusion Matrix for CNN
Model
Class 18 reports 232 accurately, whereas 16 are
errors. Also in the case of 6 with 1 mistake and
Fig8: Accuracy Graph
Fig 9: CNN with augmentation by proposed model 348 properly anticipated. The author obtained
. encouraging results after processing the data
using these techniques and the evaluation
procedure. Table 4 displays the outcomes for the
sign MNIST dataset: using the suggested
methods, I achieved good accuracy.
Fig10:Accuracy in Training and validation Fig
11:Accuracy in Training and validationof Normal Table5: Comparison between proposed and state-of-
of proposed modelCNN Model the-art work
– 415 –