
Page 274 - Kaleidoscope Academic Conference Proceedings 2024
P. 274
2024 ITU Kaleidoscope Academic Conference
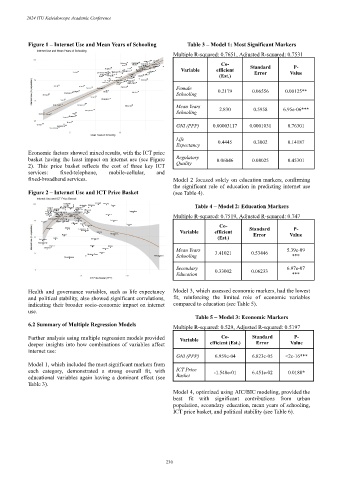
Figure 1 – Internet Use and Mean Years of Schooling Table 3 – Model 1: Most Significant Markers
Multiple R-squared: 0.7651, Adjusted R-squared: 0.7531
Co-
P-
Variable efficient Standard Value
Error
(Est.)
Female 0.2179 0.06556 0.00125**
Schooling
Mean Years 2.830 0.5958 6.95e-06***
Schooling
GNI (PPP) 0.00003117 0.0001031 0.76301
Life 0.4445 0.3002 0.14187
Expectancy
Economic factors showed mixed results, with the ICT price
basket having the least impact on internet use (see Figure Regulatory 0.06046 0.08025 0.45301
2). This price basket reflects the cost of three key ICT Quality
services: fixed-telephone, mobile-cellular, and
fixed-broadband services. Model 2 focused solely on education markers, confirming
the significant role of education in predicting internet use
Figure 2 – Internet Use and ICT Price Basket (see Table 4).
Table 4 – Model 2: Education Markers
Multiple R-squared: 0.7519, Adjusted R-squared: 0.747
Co- Standard P-
Variable efficient Error Value
(Est.)
Mean Years 3.41021 0.53446 5.39e-09
Schooling ***
Secondary 6.97e-07
Education 0.33002 0.06233 ***
Health and governance variables, such as life expectancy Model 3, which assessed economic markers, had the lowest
and political stability, also showed significant correlations, fit, reinforcing the limited role of economic variables
indicating their broader socio-economic impact on internet compared to education (see Table 5).
use.
Table 5 – Model 3: Economic Markers
6.2 Summary of Multiple Regression Models
Multiple R-squared: 0.529, Adjusted R-squared: 0.5197
Further analysis using multiple regression models provided Variable Co- Standard P-
deeper insights into how combinations of variables affect efficient (Est.) Error Value
internet use:
GNI (PPP) 6.959e-04 6.823e-05 <2e-16***
Model 1, which included the most significant markers from
each category, demonstrated a strong overall fit, with ICT Price -1.540e-01 6.451e-02 0.0188*
educational variables again having a dominant effect (see Basket
Table 3).
Model 4, optimized using AIC/BIC modeling, provided the
best fit with significant contributions from urban
population, secondary education, mean years of schooling,
ICT price basket, and political stability (see Table 6).
– 230 –