
Page 85 - Implementation of ITU-T international standards for sustainable management of waste electrical and electronic equipment: The path to a circular economy in Costa Rica
P. 85
Implementation of ITU-T international standards for sustainable management of waste
electrical and electronic equipment: The path to a circular economy in Costa Rica
addition, it would allow measuring compliance with Target 3.2 of the Connect 2030 Agenda,
which aims to raise the global WEEE recycling rate to 30 per cent.
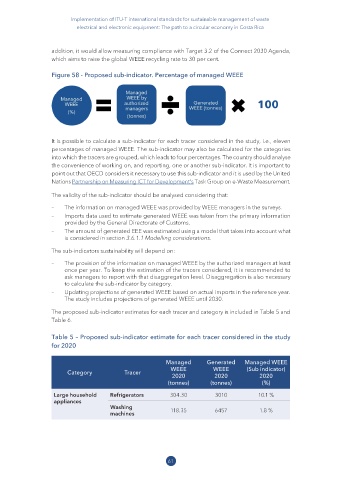
Figure 58 - Proposed sub-indicator Percentage of managed WEEE
It is possible to calculate a sub-indicator for each tracer considered in the study, i.e., eleven
percentages of managed WEEE. The sub-indicator may also be calculated for the categories
into which the tracers are grouped, which leads to four percentages. The country should analyse
the convenience of working on, and reporting, one or another sub-indicator. It is important to
point out that OECD considers it necessary to use this sub-indicator and it is used by the United
Nations Partnership on Measuring ICT for Development's Task Group on e-Waste Measurement.
The validity of the sub-indicator should be analysed considering that:
– The information on managed WEEE was provided by WEEE managers in the surveys.
– Imports data used to estimate generated WEEE was taken from the primary information
provided by the General Directorate of Customs.
– The amount of generated EEE was estimated using a model that takes into account what
is considered in section 3.6.1.1 Modelling considerations.
The sub-indicators sustainability will depend on:
– The provision of the information on managed WEEE by the authorized managers at least
once per year. To keep the estimation of the tracers considered, it is recommended to
ask managers to report with that disaggregation level. Disaggregation is also necessary
to calculate the sub-indicator by category.
– Updating projections of generated WEEE based on actual imports in the reference year.
The study includes projections of generated WEEE until 2030.
The proposed sub-indicator estimates for each tracer and category is included in Table 5 and
Table 6.
Table 5 – Proposed sub-indicator estimate for each tracer considered in the study
for 2020
Managed Generated Managed WEEE
WEEE WEEE (Sub indicator)
Category Tracer
2020 2020 2020
(tonnes) (tonnes) (%)
Large household Refrigerators 304.30 3010 10.1 %
appliances
Washing 118.35 6457 1.8 %
machines
61