
Page 68 - Implementation of ITU-T international standards for sustainable management of waste electrical and electronic equipment: The path to a circular economy in Costa Rica
P. 68
Implementation of ITU-T international standards for sustainable management of waste
electrical and electronic equipment: The path to a circular economy in Costa Rica
Table 4 - Fine fractions analysed for the study
Scarce or critical
Basic metals Heavy metals Precious metals
elements
1. Aluminium 6. Lead 10. Copper 16. Nibium
2. Iron 7. Tin 11. Gold (Columbium)
3. Lithium 8. Mercury 12. Silver 17. Tantalus
4. Silicon 9. Cadmium 13. Platinum 18. Cerium
5. Zinc 14. Iridium 19. Itrium
15. Palladium 20. Antimony
21. Neodymium
22. Americium
23. Germanium
3 6 2 Material flows
Using the information generated on the eleven tracers considered in the study, current and
future material flows were developed and are described in the following sections.
3.6.2.1 Current material flows
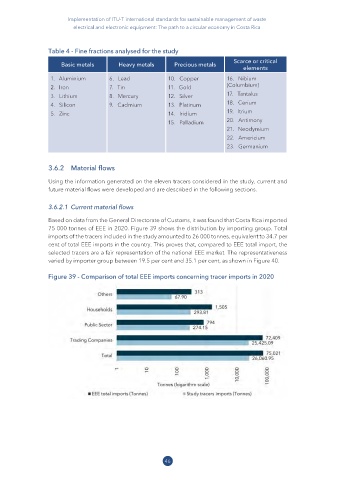
Based on data from the General Directorate of Customs, it was found that Costa Rica imported
75 000 tonnes of EEE in 2020. Figure 39 shows the distribution by importing group. Total
imports of the tracers included in the study amounted to 26 000 tonnes, equivalent to 34.7 per
cent of total EEE imports in the country. This proves that, compared to EEE total import, the
selected tracers are a fair representation of the national EEE market. The representativeness
varied by importer group between 19.5 per cent and 35.1 per cent, as shown in Figure 40.
Figure 39 - Comparison of total EEE imports concerning tracer imports in 2020
46