
Page 46 - ITU Journal Future and evolving technologies Volume 2 (2021), Issue 5 – Internet of Everything
P. 46
ITU Journal on Future and Evolving Technologies, Volume 2 (2021), Issue 5
5. CONCLUSION
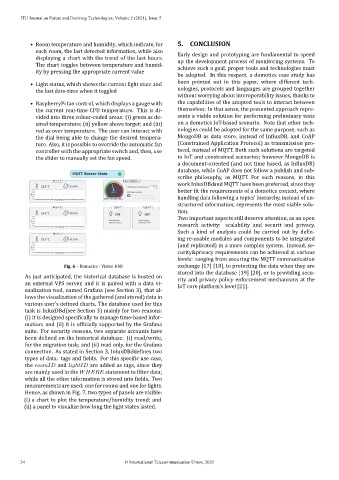
• Room temperature and humidity, which indicate, for
each room, the last detected information, while also
Early design and prototyping are fundamental to speed
displaying a chart with the trend of the last hours.
up the development process of monitoring systems. To
The chart toggles between temperature and humid-
achieve such a goal, proper tools and technologies must
ity by pressing the appropriate current value
be adopted. In this respect, a domotics case study has
been pointed out in this paper, where different tech‑
• Light status, which shows the current light state and
nologies, protocols and languages are grouped together
the last date‑time when it toggled
without worrying about interoperability issues, thanks to
• RaspberryPi fan control, which displays a gauge with the capabilities of the adopted tools to interact between
themselves. In that sense, the presented approach repre‑
the current real‑time CPU temperature. This is di‑
vided into three colour‑coded areas: (i) green as de‑ sents a viable solution for performing preliminary tests
on a domotics IoT‑based scenario. Note that other tech‑
sired temperature; (ii) yellow above target; and (iii)
red as over temperature. The user can interact with nologies could be adopted for the same purpose, such as
the dial being able to change the desired tempera‑ MongoDB as data store, instead of In luxDB, and CoAP
(Constrained Application Protocol) as transmission pro‑
ture. Also, it is possible to override the automatic fan
controller with the appropriate switch and, then, use tocol, instead of MQTT. Both such solutions are targeted
the slider to manually set the fan speed. to IoT and constrained scenarios; however MongoDB is
a document‑oriented (and not time based, as In luxDB)
database, while CoAP does not follow a publish and sub‑
scribe philosophy, as MQTT. For such reasons, in this
work InluxDBԀand MQTT have been preferred, since they
better it the requirements of a domotics context, where
handling data following a topics’ hierarchy, instead of un‑
structured information, represents the most viable solu‑
tion.
Two important aspects still deserve attention, as an open
research activity: scalability and securit and privacy.
Such a kind of analysis could be carried out by de in‑
ing re‑usable modules and components to be integrated
(and replicated) in a more complex system. Instead, se‑
curity&privacy requirements can be achieved at various
levels: ranging from securing the MQTT communication
Fig. 6 – Domotics ‑ Vision HMI exchange [17] [18], to protecting the data when they are
stored into the database [19] [20], or to providing secu‑
As just anticipated, the historical database is hosted on
rity and privacy policy enforcement mechanisms at the
an external VPS server, and it is paired with a data vi‑
IoT core platform’s level [21].
sualization tool, named Grafana (see Section 3), that al‑
lows the visualization of the gathered (and stored) data in
various user’s de ined charts. The database used for this
task is InluxDBԀ(see Section 3) mainly for two reasons:
(i) it is designed speci ically to manage time‑based infor‑
mation; and (ii) it is of icially supported by the Grafana
suite. For security reasons, two separate accounts have
been de ined on the historical database: (i) read/write,
for the migration task; and (ii) read only, for the Grafana
connection. As stated in Section 3, InluxDBԀde ines two
types of data: tags and ields. For this speci ic use case,
the and ℎ are added as tags, since they
are mainly used in the statement to ilter data;
while all the other information is stored into ields. Two
measurements are used: one for rooms and one for lights.
Hence, as shown in Fig. 7, two types of panels are visible:
(i) a chart to plot the temperature/humidity trend; and
(ii) a panel to visualize how long the light states lasted.
34 © International Telecommunication Union, 2021