
Page 134 - ITU Journal Future and evolving technologies Volume 2 (2021), Issue 4 – AI and machine learning solutions in 5G and future networks
P. 134
ITU Journal on Future and Evolving Technologies, Volume 2 (2021), Issue 4
Table 2 – Some Raymobtime datasets.
Frequency Number of receivers Time between Time between Number of Number of scenes Number of valid
Dataset name
(GHz) and type scenes (ms) episodes (s) episodes per episode channels
s001 60 10 Mobile 100 30 116 50 41 K
s005 2.8 and 5 10 Fixed 10 35 125 80 100 K
s006 28 and 60 10 Fixed 1 35 200 10 20 K
s008 60 10 Mobile ‑ 30 2086 1 11 K
s011 (new) 60 10 Mobile 500 6 76 20 13K
s012 (new) 60 10 Fixed 500 6 105 20 21K
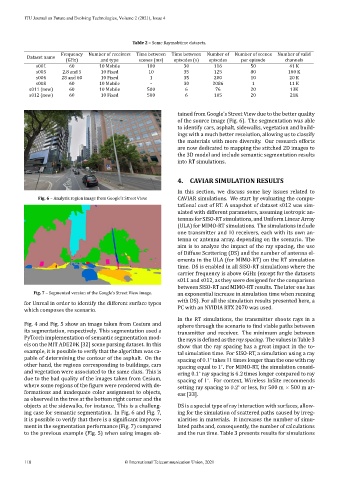
tained from Google’s Street View due to the better quality
of the source image (Fig. 6). The segmentation was able
to identify cars, asphalt, sidewalks, vegetation and build‑
ings with a much better resolution, allowing us to classify
the materials with more diversity. Our research efforts
are now dedicated to mapping the stitched 2D images to
the 3D model and include semantic segmentation results
into RT simulations.
4. CAVIAR SIMULATION RESULTS
In this section, we discuss some key issues related to
Fig. 6 – Analysis region image from Google’s Street View. CAVIAR simulations. We start by evaluating the compu‑
tational cost of RT. A snapshot of dataset s012 was sim‑
ulated with different parameters, assuming isotropic an‑
tennas for SISO‑RT simulations, and Uniform Linear Array
(ULA) for MIMO‑RT simulations. The simulations include
one transmitter and 10 receivers, each with its own an‑
tenna or antenna array, depending on the scenario. The
aim is to analyze the impact of the ray spacing, the use
of Diffuse Scattering (DS) and the number of antenna el‑
ements in the ULA (for MIMO‑RT) on the RT simulation
time. DS is enabled in all SISO‑RT simulations where the
carrier frequency is above 6GHz (except for the datasets
s011 and s012, as they were designed for the comparison
between SISO‑RT and MIMO‑RT results. The later one has
Fig. 7 – Segmented version of the Google’s Street View image. an exponential increase in simulation time when running
with DS). For all the simulation results presented here, a
for Unreal in order to identify the different surface types
which composes the scenario. PC with an NVIDIA RTX 2070 was used.
In the RT simulations, the transmitter shoots rays in a
Fig. 4 and Fig. 5 show an image taken from Cesium and sphere through the scenario to ind viable paths between
its segmentation, respectively. This segmentation used a transmitter and receiver. The minimum angle between
PyTorch implementation of semantic segmentation mod‑ the rays is de ined as the ray spacing. The values in Table 3
els on the MIT ADE20K [32] scene parsing dataset. In this show that the ray spacing has a great impact in the to‑
example, it is possible to verify that the algorithm was ca‑ tal simulation time. For SISO‑RT, a simulation using a ray
pable of determining the contour of the asphalt. On the spacing of 0.1 takes 11 times longer than the one with ray
∘
other hand, the regions corresponding to buildings, cars spacing equal to 1 . For MIMO‑RT, the simulation consid‑
∘
and vegetation were associated to the same class. This is ering 0.1 ray spacing is 6.2 times longer compared to ray
∘
due to the bad quality of the images taken from Cesium, spacing of 1 . For context, Wireless InSite recommends
∘
where some regions of the igure were rendered with de‑ setting ray spacing to 0.2 or less, for 500 m × 500 m ar‑
∘
formations and inadequate color assignment to objects, eas [33].
as observed in the tree at the bottom right corner and the
objects at the sidewalks, for instance. This is a challeng‑ DS is a special type of ray interaction with surfaces, allow‑
ing case for semantic segmentation. In Fig. 6 and Fig. 7, ing for the simulation of scattered paths caused by irreg‑
it is possible to verify that there is a signi icant improve‑ ularities in materials. It increases the number of simu‑
ment in the segmentation performance (Fig. 7) compared lated paths and, consequently, the number of calculations
to the previous example (Fig. 5) when using images ob‑ and the run time. Table 3 presents results for simulations
118 © International Telecommunication Union, 2021