
Page 149 - ITU Journal Future and evolving technologies – Volume 2 (2021), Issue 2
P. 149
ITU Journal on Future and Evolving Technologies, Volume 2 (2021), Issue 2
distance of the signal on the fronthaul link depending on
the type of technology used and the network topology.
If in the standard case, the throughput is dsym, and the
cloud, the processing unit in the cloud takes care of pro‑
cessing of x RRH, the additional latency in the network is
given by:
)
= 3161, 3( −0,588 − 3161, 3 −0,588 +
= 3161, 3 −0,588 ( 0,588 − 1) +
(17)
: additional latency that this scenario induces in the
network.
D in metre (m) and V in metre per millisecond (m/ms).
In sum, in scenario 5, this latency constraint must be
taken into account by minimizing .
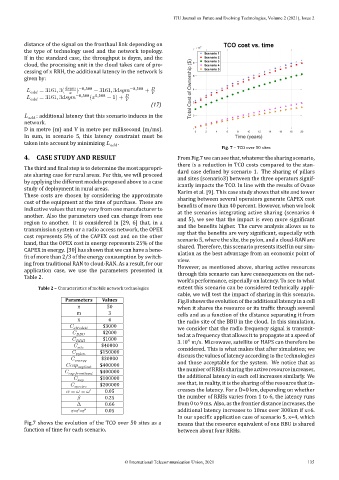
Fig. 7 – TCO over 50 sites
4. CASE STUDY AND RESULT FromFig.7wecanseethat, whateverthesharingscenario,
there is a reduction in TCO costs compared to the stan‑
The third and inal step is to determine the most appropri‑
dard case de ined by scenario 1. The sharing of pillars
ate sharing case for rural areas. For this, we will proceed
and sites (scenario3) between the three operators signif‑
by applying the different models proposed above to a case icantly impacts the TCO. In line with the results of Ovase
study of deployment in rural areas.
Karim et al. [9]. This case study shows that site and tower
These costs are chosen by considering the approximate
sharing between several operators generate CAPEX cost
cost of the equipment at the time of purchase. These are
bene its of more than 40 percent. However, when we look
indicative values that may vary from one manufacturer to
at the scenarios integrating active sharing (scenarios 4
another. Also the parameters used can change from one
and 5), we see that the impact is even more signi icant
region to another. It is considered in [29, 6] that, in a
and the bene its higher. The curve analysis allows us to
transmission system or a radio access network, the OPEX
say that the bene its are very signi icant, especially with
cost represents 5% of the CAPEX cost and on the other
scenario 5, where the site, the pylon, and a cloud‑RAN are
hand, that the OPEX cost in energy represents 25% of the
shared. Therefore, this scenario presents itself in our sim‑
CAPEX in energy. [30] has shown that we can have a bene‑
ulation as the best advantage from an economic point of
it of more than 2/3 of the energy consumption by switch‑
view.
ing from traditional RAN to cloud‑RAN. As a result, for our
However, as mentioned above, sharing active resources
application case, we use the parameters presented in
through this scenario can have consequences on the net‑
Table 2.
work’s performance, especially on latency. To see to what
Table 2 – Characteristics of mobile network technologies extent this scenario can be considered technically appli‑
cable, we will test the impact of sharing in this scenario.
Parameters Values Fig.8 shows the evolution of the additional latency in a cell
n 50 when it shares the resource or its traf ic through several
m 3 cells and as a function of the distance separating it from
x 4 the radio site of the BBU in the cloud. In this simulation,
$3000 we consider that the radio frequency signal is transmit‑
$2000 ted at a frequency that allows it to propagate at a speed of
$1000
8
3.10 m/s. Microwave, satellite or HAPS can therefore be
$40000
$150000 considered. This is what makes that after simulation; we
$30000 discuss the values of latency according to the technologies
$400000 and those acceptable for the system. We notice that as
ℎ $400000 the numberof RRHssharing the activeresource increases,
$100000 the additional latency in each cell increases similarly. We
$200000 see that, in reality, it is the sharing of the resource that in‑
= = ′ 0.05 creases the latency. For a D=0 km, depending on whether
0.25 the number of RRHs varies from 1 to 6, the latency runs
Δ 0.66 from 0 to 9 ms. Also, as the frontier distance increases, the
r=r’=r” 0.05 additional latency increases to 10ms over 300km if x=6.
In our speci ic application case of scenario 5, x=4, which
Fig.7 shows the evolution of the TCO over 50 sites as a means that the resource equivalent of one BBU is shared
function of time for each scenario. between about four RRHs.
© International Telecommunication Union, 2021 135