
Page 148 - ITU Journal Future and evolving technologies – Volume 2 (2021), Issue 2
P. 148
ITU Journal on Future and Evolving Technologies, Volume 2 (2021), Issue 2
in LTE, the latency is 10 ms for a theoretical bit through‑
put of 326megabits per second (Mb/s). Table 1 presents
( ) = (( ) + ( ) + ( ). + . ) the characteristics of different mobile network evolution.
′
″ −1
(1 + ∑(1 − ) −1 ) + (1 + ∑(1 − ) )
=1 =1
1
.( ). ℎ + (1 + . ) .Δ. + . +
(16)
Although this scenario allows for asset sharing, it should
be noted that the centralisation of BBU presents certain
challenges, one of the main ones being the fronthaul
requirements. Indeed, this link’s time budget or allow‑
able latency is 1 ms and 2 ms for the downlink and
uplink, respectively [17]. Because of this constraint,
many studies propose ibre deployment for the fronthaul
[25, 26]. However, in the context of remote areas, this
is not appropriate for several reasons. These areas are
sometimes challenging to access, and ibre deployment is
costly for these areas.
The limitation that can be observed in the latter scenario
is that active resource sharing induces additional latency
in the network. The latency is the time for a packet to
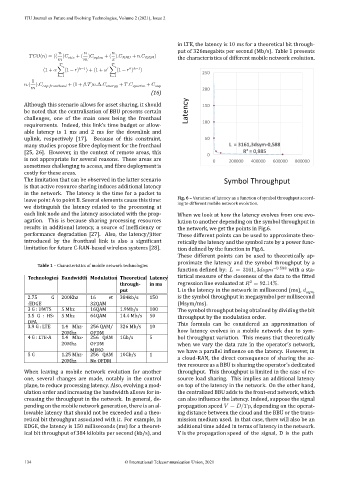
leave point A to point B. Several elements cause this time: Fig. 6 – Variation of latency as a function of symbol throughput accord‑
ing to different mobile network evolution.
we distinguish the latency related to the processing at
each link node and the latency associated with the prop‑ When we look at how the latency evolves from one evo‑
agation. This is because sharing processing resources lution to another depending on the symbol throughput in
results in additional latency, a source of inef iciency or the network, we get the points in Fig.6.
performance degradation [27]. Also, the latency/jitter These different points can be used to approximate theo‑
introduced by the fronthaul link is also a signi icant retically the latency and the symbol rate by a power func‑
limitation for future C‑RAN‑based wireless systems [28]. tion de ined by the function in Fig.6.
These different points can be used to theoretically ap‑
proximate the latency and the symbol throughput by a
Table 1 – Characteristics of mobile network technologies
function de ined by: = 3161, 3 −0.588 with a sta‑
Technologies Bandwidth Modulation Theoretical Latency tistical measure of the closeness of the data to the itted
2
through‑ in ms regression line evaluated at = 92.14%.
put L is the latency in the network in millisecond (ms),
2.75 G 200Khz 16 et 384kb/s 150 is the symbol throughput in megasymbol per millisecond
:EDGE 32QAM (Msym/ms).
3 G : UMTS 5 Mhz 16QAM 1.9Mb/s 100 The symbol throughput being obtained by dividing the bit
3.5 G : HS‑ 5 Mhz 64QAM 14.4 Mb/s 50 throughput by the modulation order.
DPA This formula can be considered an approximation of
3.9 G : LTE 1.4 Mhz‑ 256 QAM/ 326 Mb/s 10
20Mhz OFDM how latency evolves in a mobile network due to sym‑
4 G : LTE‑A 1.4 Mhz‑ 256 QAM 1Gb/s 5 bol throughput variation. This means that theoretically
20Mhz OFDM when we vary the data rate in the operator’s network,
MIMO we have a parallel in luence on the latency. However, in
5 G 1.25 Mhz‑ 256 QAM 10Gb/s 1
20Mhz No OFDM a cloud‑RAN, the direct consequence of sharing the ac‑
tive resource as a BBU is sharing the operator’s dedicated
When leaving a mobile network evolution for another throughput. This throughput is limited in the case of re‑
one, several changes are made, notably in the control source load sharing. This implies an additional latency
plane, to reduce processing latency. Also, evolving a mod‑ on top of the latency in the network. On the other hand,
ulation order and increasing the bandwidth allows for in‑ the centralized BBU adds to the front‑end network, which
creasing the throughput in the network. In general, de‑ can also in luence the latency. Indeed, suppose the signal
pending on the mobile network generation, there is an al‑ propagation speed = / , depending on the operat‑
lowable latency that should not be exceeded and a theo‑ ing distance between the cloud and the BBU or the trans‑
retical bit throughput associated with it. For example, in mission medium used. In that case, there will also be an
EDGE, the latency is 150 milliseconds (ms) for a theoret‑ additional time added in terms of latency in the network.
ical bit throughput of 384 kilobits per second (kb/s), and V is the propagation speed of the signal, D is the path
134 © International Telecommunication Union, 2021