
Page 89 - Kaleidoscope Academic Conference Proceedings 2020
P. 89
Industry-driven digital transformation
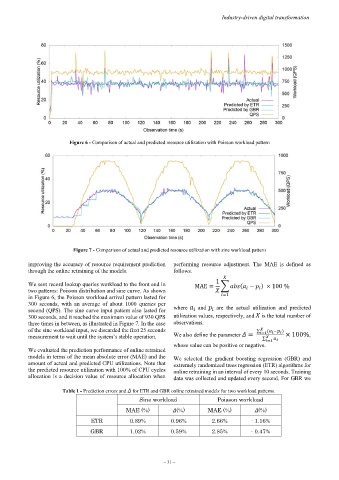
Figure 6 - Comparison of actual and predicted resource utilization with Poisson workload pattern
Figure 7 - Comparison of actual and predicted resource utilization with sine workload pattern
improving the accuracy of resource requirement prediction performing resource adjustment. The MAE is defined as
through the online retraining of the models. follows.
We sent record lookup queries workload to the front end in MAE = 1 � ( − ) × 100 %
two patterns: Poisson distribution and sine curve. As shown
in Figure 6, the Poisson workload arrival pattern lasted for =1
300 seconds, with an average of about 1000 queries per
second (QPS). The sine curve input pattern also lasted for where and are the actual utilization and predicted
300 seconds, and it reached the maximum value of 930 QPS utilization values, respectively, and is the total number of
three times in between, as illustrated in Figure 7. In the case observations.
of the sine workload input, we discarded the first 25 seconds ∑ ( − )
measurement to wait until the system’s stable operation. We also define the parameter = =1 × 100%,
∑
whose value can be positive or negative. =1
We evaluated the prediction performance of online retrained
models in terms of the mean absolute error (MAE) and the We selected the gradient boosting regression (GBR) and
amount of actual and predicted CPU utilizations. Note that extremely randomized trees regression (ETR) algorithms for
the predicted resource utilization with 100% of CPU cycles online retraining in an interval of every 10 seconds. Training
allocation is a decision value of resource allocation when data was collected and updated every second. For GBR we
Table 1 - Prediction errors and for ETR and GBR online retrained models for two workload patterns.
Sine workload Poisson workload
MAE (%) (%) MAE (%) (%)
ETR 0.89% 0.96% 2.66% - 1.16%
GBR 1.02% 0.59% 2.85% - 0.47%
– 31 –