
Page 152 - Kaleidoscope Academic Conference Proceedings 2020
P. 152
2020 ITU Kaleidoscope Academic Conference
Table 2 – User experience testing Table 3 – Device compatibility and performance testing
User questions User responses Required/Suggested Device compatibility Performance testing
Changes testing
Did the user The user launched Suggestions on logo 1 The application had issues The load time of the
struggle to the application design. with screen layout on application took long to
launch the without assistance. other devices but a fix launch on other devices
application? was provided to have because they had less space
Did the users yes but it was The application was the application open in and not enough memory.
find the noted that the usable according landscape whenever it is A fix was to create space
application incorporated to the users. opened. for the application on such
usable? Google maps was The proximity devices.
redundant. based notifications 2 The application failed to run The application was
were considered on devices that had outdated unstable at times when it
unnecessary and Android OS. A fix was done was loaded on multiple
not used by users. by updating the software devices at the same time.
Users seem to and run latest version of A potential fix might be to
have preferred the Android OS. compress the images stored
simple process of on the database or improve
scanning markers network bandwidth of
only. users.
Did the users Yes and had to The inclusion of 3 The application had no Scalability was manageable
issues running on other by the as it was able
manage to exit be assisted by the an exit button
Android devices that had to allow multiple users
the application? moderator. was suggested.
the latest version of Android to load the application
However, exiting
OS. without fault. However,
the application was
occasionally slow downs
similar to exiting
were noticed when multiple
the camera app
users were scanning /
on any phone and
requesting objects from the
did not require a
database.
dedicated button.
app to get useful information about plants.
4.2.3 Device Performance Test
Table 2 shows the results of user acceptance tests while
During device compatibility a major issue encountered while Table 3 shows the results of both device compatibility and
testing was the layout not being consistent across different performance testing results gathered during the testing of the
screen sizes. As expected the load time varied across devices, application. The tables provide errors/bugs and associated
as phones with higher processor clock speeds loaded the solutions.
application faster than those with lower speed. Scalability
was also a challenge, as stutters and longer response times 5. CONCLUSION
were observed when more users connected to the system. This
might have been caused by a number of reasons, including i.) The objective of this study was to develop a virtual tour
the Cloud computer server on which the database was hosted, guide based on Augmented Reality (AR). This would enable
ii.) the network bandwidth of the individual users, and iii.) self-tours of the Cape Flats Nature reserve in the Western
the fact that we deployed our system on the free version of Cape province of South Africa. AR markers were placed at
Vuforia. interest points around the nature reserve and tourists having
installed the accompanying application on their capable
mobile phones can simply scan the markers with their phone
4.2.4 Outdoor Testing
This test was performed outdoors at a nature reserve with
two users and a moderator to test reliability of the application
and satisfaction of users. Both users were happy with the
information that was provided at the entrance of the nature
reserve as it stated and showed how the application can be
used when there are markers next to a plant. One user was
satisfied with reliability of the application but stated what can
be improved. The other user was satisfied with the overall
application but had comments about reliability.
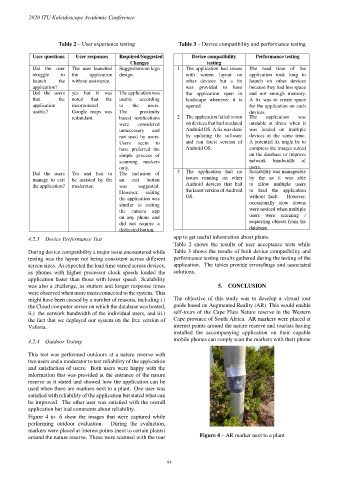
Figure 4 to- 6 show the images that were captured while
performing outdoor evaluation. During the evaluation,
markers were placed at interest points (next to certain plants)
around the nature reserve. These were scanned with the tour Figure 4 – AR marker next to a plant
– 94 –