
Page 64 - ITU Journal: Volume 2, No. 1 - Special issue - Propagation modelling for advanced future radio systems - Challenges for a congested radio spectrum
P. 64
ITU Journal: ICT Discoveries, Vol. 2(1), December 2019
Chilton and 97.82% for Chilbolton. Regarding the attenuation, i.e. the combination of all the
processed rainfall data, NTUA has 100.00% propagation impairments except for the gaseous
availability for both locations while RAL Space has attenuation, overestimates the actual measured
98.93% availability for Chilton and 98.81% values. This is more evident at the English sites
availability for Chilbolton. where the elevation angles are lower compared to
the Greek sites and therefore the former experience
3.1 Single site statistics receivers
more cloud attenuation. In Figures 3 and 4 a
Table 2 summarizes the annual measured rain modified methodology proposed in [8] for the
characteristics in two locations in Greece and the calculation of in-excess attenuation using the ITU-R
UK. Rainfall data in mm have been converted to model is also shown. As can be observed it yields
rainfall rate in mm/h using a 60 second integration better results in all the campaign locations.
window according to the methodology in [11]. The
annual probability of (detectable) rain, i.e. the
probability that the rain rate is greater than
0.25 mm/h, is higher in England than in Greece. As
an example, there is detectable rain in Attica, Greece
for about 365x24x0.01=87.6 hours/year on average
whereas in the UK 365x24x0.04=350.4 hours/year.
However, the rain rate used in the ITU-R Predictions
Model (ITU-R Rec. P.618-13) [7], i.e. at 0.01% of the
year or 52.56 minutes/year, is much higher in
Greece. This is reflected in the attenuation statistics
depicted in Figures 1 and 2.
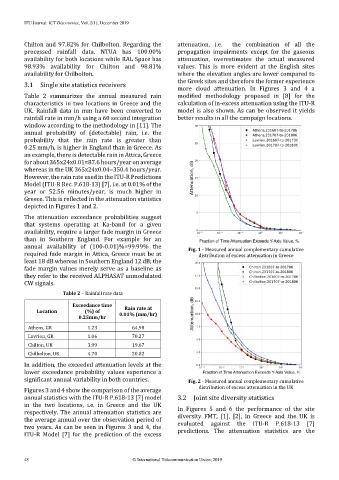
The attenuation exceedance probabilities suggest
that systems operating at Ka-band for a given
availability, require a larger fade margin in Greece
than in Southern England. For example for an
annual availability of (100-0.01)%=99.99% the Fig. 1 - Measured annual complementary cumulative
required fade margin in Attica, Greece must be at distribution of excess attenuation in Greece
least 18 dB whereas in Southern England 12 dB; the
fade margin values merely serve as a baseline as
they refer to the received ALPHASAT unmodulated
CW signals.
Table 2 – Rainfall rate data
Exceedance time Rain rate at
Location (%) of 0.01% (mm/hr)
0.25mm/hr
Athens, GR 1.23 64,98
Lavrion, GR 1.06 70.27
Chilton, UK 3.99 19.67
Chilbolton, UK 4.70 20.82
In addition, the exceeded attenuation levels at the
lower exceedance probability values experience a
significant annual variability in both countries. Fig. 2 - Measured annual complementary cumulative
Figures 3 and 4 show the comparison of the average distribution of excess attenuation in the UK
annual statistics with the ITU-R P.618-13 [7] model 3.2 Joint site diversity statistics
in the two locations, i.e. in Greece and the UK
respectively. The annual attenuation statistics are In Figures 5 and 6 the performance of the site
the average annual over the observation period of diversity FMT, [1], [2], in Greece and the UK is
two years. As can be seen in Figures 3 and 4, the evaluated against the ITU-R P.618-13 [7]
predictions. The attenuation statistics are the
ITU-R Model [7] for the prediction of the excess
48 © International Telecommunication Union, 2019