
Page 151 - ITU KALEIDOSCOPE, ATLANTA 2019
P. 151
ICT for Health: Networks, standards and innovation
1 2 3 4 5 6 7 8 9 10
Precision Recall F1 Precision Recall F1
96.00% 96.00%
94.00% 94.00% 100%
92.00%
92.00%
90.00% 90.00% 90%
88.00% 88.00% 80%
86.00%
84.00% 86.00% 70%
82.00% 84.00%
80.00% 82.00% 60%
78.00% 80.00% 50%
MS KM VPRS Hypertension Diabetes Heart Diseases Two Diseases
40%
(a) (b) 30%
20%
10%
Figure 3 – (a)The results of MS, KM and VPRS; (b) the 0% EC UR Acc RS IT AR
results of SM for different geriatrics.
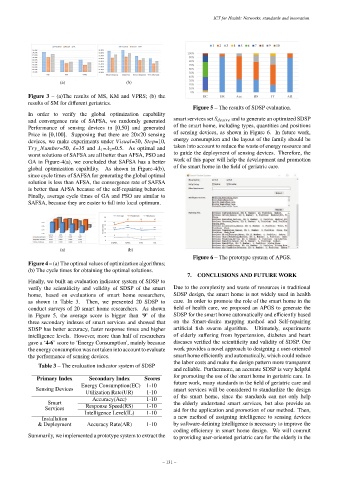
Figure 5 – The results of SDSP evaluation.
In order to verify the global optimization capability
and convergence rate of SAFSA, we randomly generated smart services set S desire and to generate an optimized SDSP
Performance of sensing devices in [0,50] and generated of the smart home, including types, quantities and positions
Price in [0,100]. Supposing that there are 20×20 sensing of sensing devices, as shown in Figure 6. In future work,
devices, we make experiments under Visual=30, Step=10, energy consumption and the layout of the family should be
Try_Number=50, δ=35 and λ 1 =λ 2 =0.5. As optimal and taken into account to reduce the waste of energy resource and
worst solutions of SAFSA are all better than AFSA, PSO and to guide the deployment of sensing devices. Therefore, the
GA in Figure-4(a), we concluded that SAFSA has a better work of this paper will help the development and promotion
global optimization capability. As shown in Figure-4(b), of the smart home in the field of geriatric care.
since cycle times of SAFSA for generating the global optimal
solution is less than AFSA, the convergence rate of SAFSA
is better than AFSA because of the self-repairing behavior.
Finally, average cycle times of GA and PSO are similar to
SAFSA, because they are easier to fall into local optimum.
Average Maximum Minimum
60
50 50 50
50
0.91 41
Cycle times 30 27.8 26.7 28.2
0.86 40 33.9
0.81
0.76 20
SAFSA AFSA PSO GA 8 9
Average Solution 0.899 0.893 0.873 0.851 10 3 4
Optimal Solution 0.904 0.904 0.899 0.897
0
Worst Solution 0.894 0.878 0.846 0.798 SAFSA AFSA PSO GA
(a) (b)
Figure 6 – The prototype system of APGS.
Figure 4 – (a) The optimal values of optimization algorithms;
(b) The cycle times for obtaining the optimal solutions.
7. CONCLUSIONS AND FUTURE WORK
Finally, we built an evaluation indicator system of SDSP to
verify the scientificity and validity of SDSP of the smart Due to the complexity and waste of resources in traditional
home, based on evaluations of smart home researchers, SDSP design, the smart home is not widely used in health
as shown in Table 3. Then, we presented 20 SDSP to care. In order to promote the role of the smart home in the
conduct surveys of 20 smart home researchers. As shown field of health care, we proposed an APGS to generate the
in Figure 5, the average score is bigger than ‘9’ of the SDSP for the smart home automatically and efficiently based
three secondary indexes of smart services and showed that on the Smart-desire mapping method and Self-repairing
SDSP has better accuracy, faster response times and higher artificial fish swarm algorithm. Ultimately, experiments
intelligence levels. However, more than half of researchers of elderly suffering from hypertension, diabetes and heart
gave a ‘4-6’ score to ‘Energy Consumption’, mainly because diseases verified the scientificity and validity of SDSP. Our
the energy consumption was not taken into account to evaluate work provides a novel approach to designing a user-oriented
the performance of sensing devices. smart home efficiently and automatically, which could reduce
Table 3 – The evaluation indicator system of SDSP the labor costs and make the design pattern more transparent
and reliable. Furthermore, an accurate SDSP is very helpful
for promoting the use of the smart home in geriatric care. In
Primary Index Secondary Index Scores future work, many standards in the field of geriatric care and
Energy Consumption(EC) 1-10
Sensing Devices smart services will be considered to standardize the design
Utilization Rate(UR) 1-10
Accuracy(Acc) 1-10 of the smart home, since the standards can not only help
Smart the elderly understand smart services, but also provide an
Services Response Speed(RS) 1-10 aid for the application and promotion of our method. Then,
Intelligence Level(IL) 1-10
Installation a new method of assigning intelligence to sensing devices
& Deployment Accuracy Rate(AR) 1-10 by software-defining intelligence is necessary to improve the
coding efficiency in smart home design. We will commit
Summarily, we implemented a prototype system to extract the to providing user-oriented geriatric care for the elderly in the
– 131 –