
Page 47 - Proceedings of the 2018 ITU Kaleidoscope
P. 47
Machine learning for a 5G future
6.3 Multi Scale Structural Similarity (MS-SSIM) 6.5 Inter packet delay
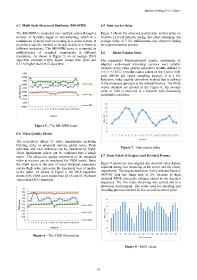
The MS-SSIM is computed over multiple scales through a Figure 7 shows the observed packet inter arrival delay on
process of multiple stages of sub-sampling, which is a JioFi4G LTE-TD network during live video streaming. An
reminiscent of multi scale processing in a vision system. It average delay of 7.125 milliseconds was observed during
provides a suitable method to include details in a frame at the experimentation process.
different resolutions. The MS-SSIM score is computed as
multiplication of weighted components at different 6.6 Mean Opinion Score
resolutions. As shown in Figure 5, on an average DS-S
algorithm provides 0.06% higher values than QDS and The parametric bitstream-based quality assessment of
0.15 % higher than DS-G algorithm. adaptive audiovisual streaming services over reliable
transport using video quality estimation module defined in
ITU-T P.1203.1 provides output values on the 5-point ACR
0.997
scale (MOS) per output sampling interval. It is a No
0.9965
Reference video quality estimation method that is utilized
0.996
0.9955 DS-G in the proposed approach as the reward function. The MOS
MS-SSIM values 0.9945 DS-S value of 3.08 is observed in a network with fluctuating
values obtained are plotted in the Figure 8. An average
0.995
bandwidth conditions.
0.994
0.9935
0.993 14
QDS
0.9925 12
1 2 3 4 5 6 7 8 9 1011 1213 1415 161718 1920
10
Delay (ms) 6
Frame # 8
Figure 5 – The MS-SSIM index 4
2
0
6.4 Video Quality Metric
12 3456 789 1011121314151617181920
The perception effects of video impairments including Packet #
blurring, jerky or unnatural motion, global noise, block
distortion and color distortion can be measured by VQM. Figure 7 – Inter packet delay
These impairment values can be combined into a single
metric. The subjective quality assessment of the streamed 6.7 Some Selected Original and Decoded Frames
video at receiver can be employed the VQM metric. Since
the VQM score is the sum of many weighted parameters Figure 9 shows the few original and decoded video frames
and its high value represents the maximum loss of quality captured during live streaming at the server and the client,
in the video. As shown in Figure 6, the DS-S algorithm respectively. The display resolution in this selected frame is
shows 25% VQM score values than QD-S and 41.5% lesser 640*360 with the frame rate of 24. Because of high
values than DS-G approach. obtained PSNR noticeable changes absent in the decoded
sequences. The live video streaming was carried out in a
laboratory environment. The codec used for encoding and
0.5 decoding process is H.264 for live as well as stored video.
0.45
0.4
0.35 4.5
VQM values 0.25 DS-G 3.5 4
0.3
0.2
0.15 3
DS-S
0.1 MOS values 2.5
0.05 2
0 QDS 1.5
12 3456 789 10 11 12 13 14 15 16 17 18 19 20
1
Frames # 0.5
0
Figure 6 – The VQM Observation 1 40 80 120 160 200 240 280 320 360 400 440 480 520 560
Time in seconds
Figure 8 – MOS values
– 31 –